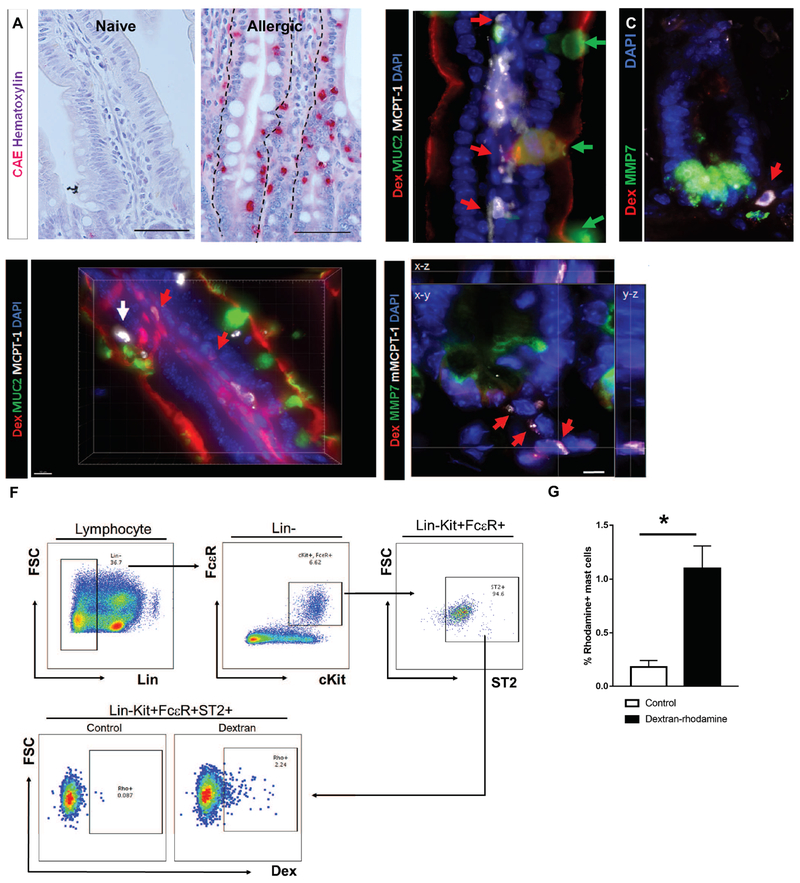
Figure 2. Antigen translocation via SAPs to underlying mast cells.
(A) CAE staining with hematoxylin counterstain on naïve and allergen challenged food allergic mice. The dotted line indicates the basal edge of the SI epithelium. (B-C) Immunofluorescence analysis for (B) MUC2 (villus) or (C) MMP7 (crypt) of SIs from food allergic mice prior to the food antigen exposure; n = 3-4 mice per group. Red arrows point to mast cells residing in close proximity to goblet cells. Green arrows point to goblet cells. The dotted line indicates the basal edge of the crypt SI epithelium. (D-E) 3D reconstruction of immunofluorescence analysis for (D) MUC2 (villus) or (E) MMP7 (crypt) of SIs from food allergic mice after the food antigen exposure; n = 3-4 mice per group. Red arrows point to Rh-Dex+ mast cells. A white arrow points to Rh-Dex− intraepithelial mast cells. (F) Flow cytometry panels for gating strategies of lamina propria mast cells and the level of Rh-Dex in gated mast cells (Lin−c-Kit+FcεR+ST2+). (G) Flow cytometry analysis of mast cells in the food allergic mouse SIs for Rh-Dex. n= 8 per group. Control mice were exposed to PBS and Dextran mice were exposed to Rh-Dex along with the food allergen OVA. Data presented are the mean ± SEM. *p < 0.05, Student t-test or one-way ANOVA. Scale bars are 50 μm for A. Scale bars are 50, 50, 10 & 5 μm for B, C, D & F respectively. The nucleus was visualized with DAPI (blue).

