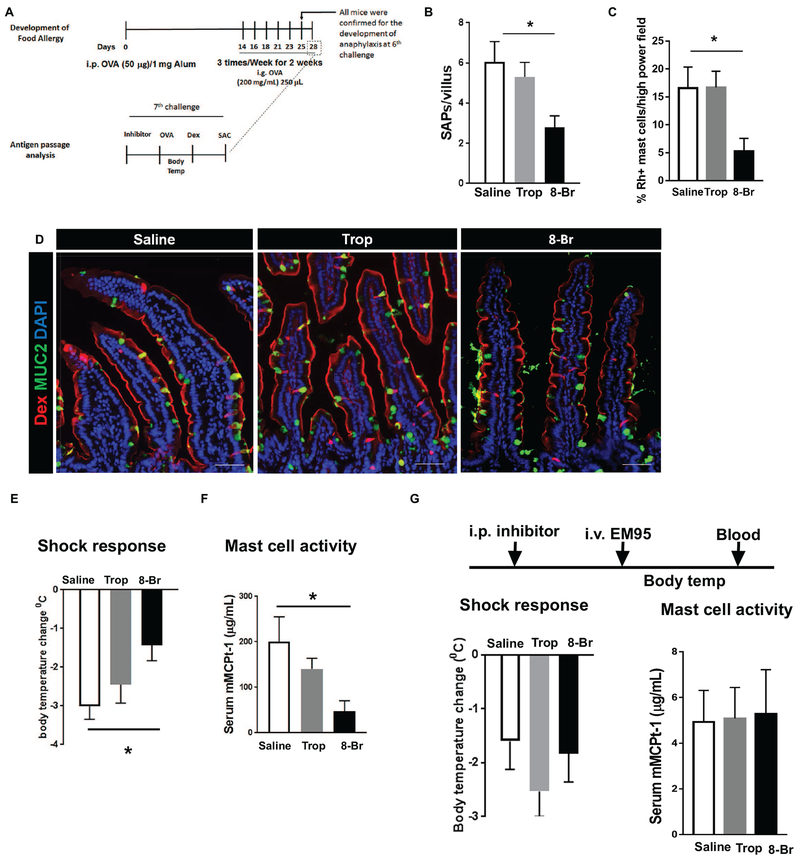
Figure 6. Blocking IL-13–driven SAP formation protects mice from the onset of acute, food-driven anaphylaxis shock.
(A) Diagram depicting experimental design for developing food allergy and analyzing SAP formation during anaphylactic shock in mice. SAC stands for sacrifice followed by tissue harvest. (B) Quantitation of SAP formation in the longitudinal SI sections of food allergic mice treated with vehicle (saline), Tropicamide (Trop), or 8-Br cADPR (8-Br). (C) Quantitation of mast cell colocalizing with dextran in SI sections of food allergic mice treated with vehicle (saline), Tropicamide (Trop), or 8-Br cADPR (8-Br). (D) Immunofluorescence analysis for MUC2 (green) and nucleus (blue) in cross sections of allergic mouse SIs exposed to Rh-Dex after oral antigen OVA challenge. (E) Core body temperature measurement of mice after the 7th oral antigen challenge on day 28 that are treated with indicated inhibitors. (F) Serum MCPT-1 level analysis in mice treaded with indicated inhibitors. (G) Experimental design to test the effect of inhibitors on shock response driven by activating mast cells: Shock response - Core body temperature was taken after the injection of EM95 (anti-IgE antibody) as described with mice treated as indicated. Mast cell activity - Serum MCPT-1 level of mice treated as indicated after the injection of EM95. *p < 0.05, one-way ANOVA. n = 3-4 mice per group. Scale bars are 50 μm. Data presented are the mean ± SEM.

