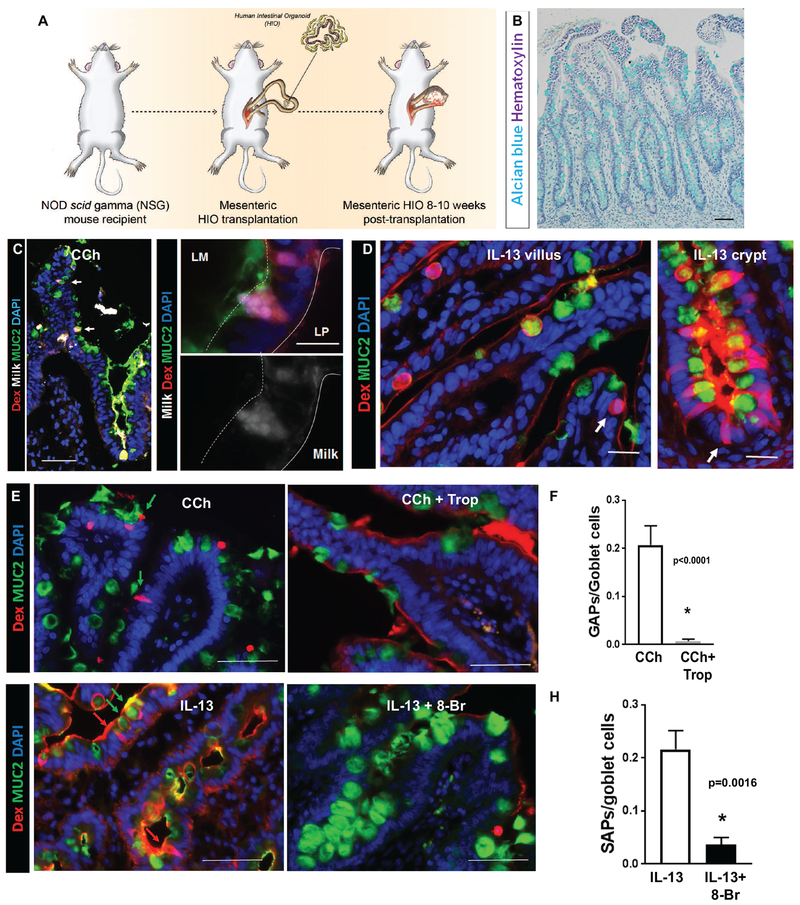
Figure 7. SAP formation pathways are conserved in human SI.
(A) Diagram of tHIO generation. (B) Alcian blue and hematoxylin of a tHIO generated as indicated in (A). (C) Immunofluorescence analysis for MUC2 (green) with in cross-sections of tHIOs exposed to Milk conjugated to Alexa 647 and Rh-Dex then stimulated with CCh. Nucleus was visualized with DAPI (blue). White arrows indicate MUC2+ Rho-Dex+ Milk-647+ GAPs. Lower (left) and higher (right) magnification images are shown. (D) Immunofluorescence analysis for MUC2 (green) with cross-sections of tHIO exposed to Rh-Dex then stimulated with IL-13. White arrows indicate MUC2− antigen passages in villus and crypts. (E&F) Immunofluorescence analysis for MUC2 (green) and nucleus (blue) of tHIOs exposed to Rh-Dex and treated as indicated. Scale bars are 50 μm. Green arrows indicate MUC2+ Rho-Dex+ antigen passages and Red arrows indicate MUC2- Rho-Dex+ antigen passages. (F&H) Quantification of GAP (F) or SAP (H) in tHIOs. n= 3-4 per group. Student t-test. * denotes statistical significance.

