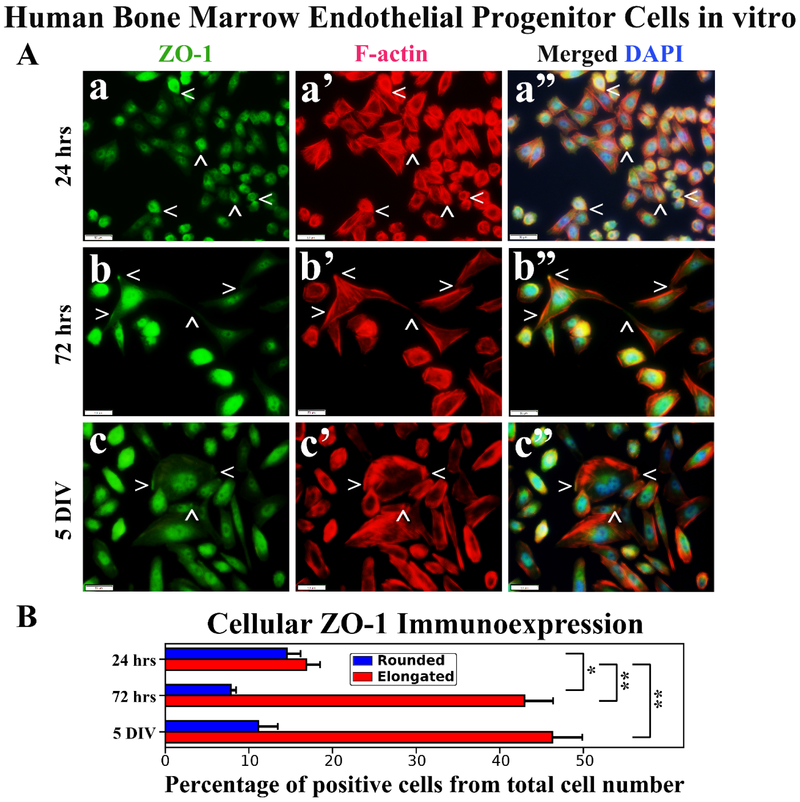
Figure 4. Immunocytochemical analysis of hBMEPCs in vitro at different time points for ZO-1 and F-actin.
(A) Rounded hBMEPCs (a) displayed diffuse presence of ZO-1 (green, arrowheads) in contrast to ZO-1 localization in elongated hBMEPCs (b, c). ZO-1 immunoexpression was mainly detected within elongated cell filopodia tips (b) or near inner cell membrane (c). Merged images (a”, b”, c”) are shown with DAPI (blue). Scale bar in a-c” is 50 μm. (B) Rounded ZO-1 immunopositive hBMEPCs prevalence decreased significantly from 24 hrs to 72 hrs and no significant differences were detected between 72 hrs and 5 DIV cultures. Prevalence of ZO-1 immunopositive elongated hBMEPCs significantly increased across all time points. *p < 0.05, **p < 0.01.

