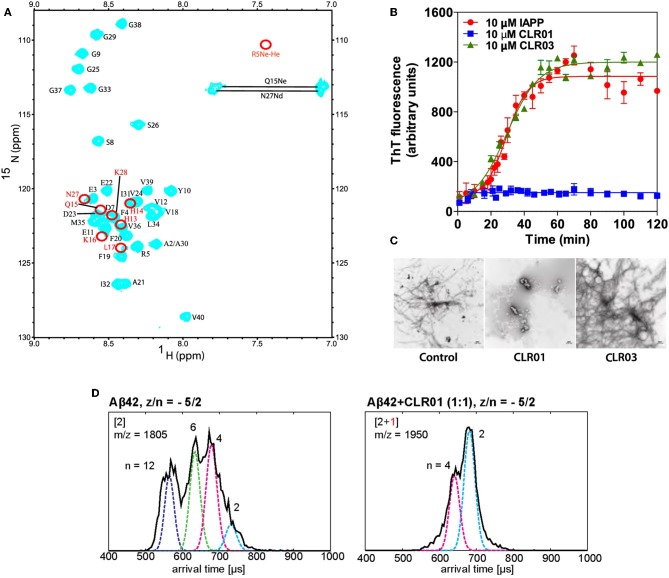
Figure 2.
(A) 15N–1H HSQC spectrum of Aβ40 in the presence of 30 μM CLR01 (cyan). Red circles indicate resonances that disappeared completely upon addition of CLR01 to Aβ40 solution (Sinha et al., 2011). (B) Time-dependent ThT fluorescence intensities of incubated solution of: pure IAPP (red); IAPP + CLR01 (1:1) (blue); IAPP+CLR03 (1:1) (green) (Sinha et al., 2011). (C) EM images of the solutions after titration. CLR01 (middle) clearly shows inhibition of fibril formation (Sinha et al., 2011). (D) Effects CLR01 on Aβ42 early oligomerization. Arrival time distributions (by ion-mobility spectrometry) of z/n = −5/2 Aβ42 (m/z = 1805) in an Aβ42 sample without CLR01 (left) and z/n = −5/2 Aβ42 and CLR01 1:1-complex (m/z = 1,950). Oligomeric species (n = 6;12) vanish after CLR01 addition (Zheng et al., 2015).

