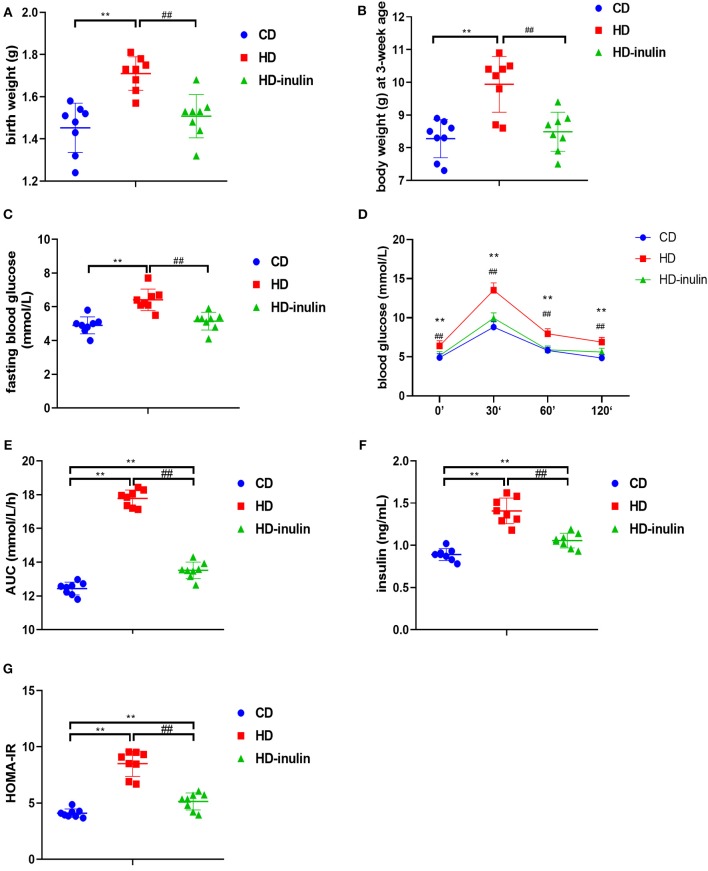
Figure 3.
Metabolic variables of male mice offspring in different groups. (A) birth weight; (B) body weight at weaning; (C) fasting blood glucose; (D) oral glucose tolerance test (OGTT); (E) area under curve (AUC) in OGTT; (F) serum insulin; (G) HOMA-IR. The data were shown as mean ± SD. n = 8 in each group. **P < 0.01 vs. CD group; ##P < 0.01 vs. HD group. CD, control diet; HD, high fat diet; HD-inulin, high fat diet with inulin supplement.

