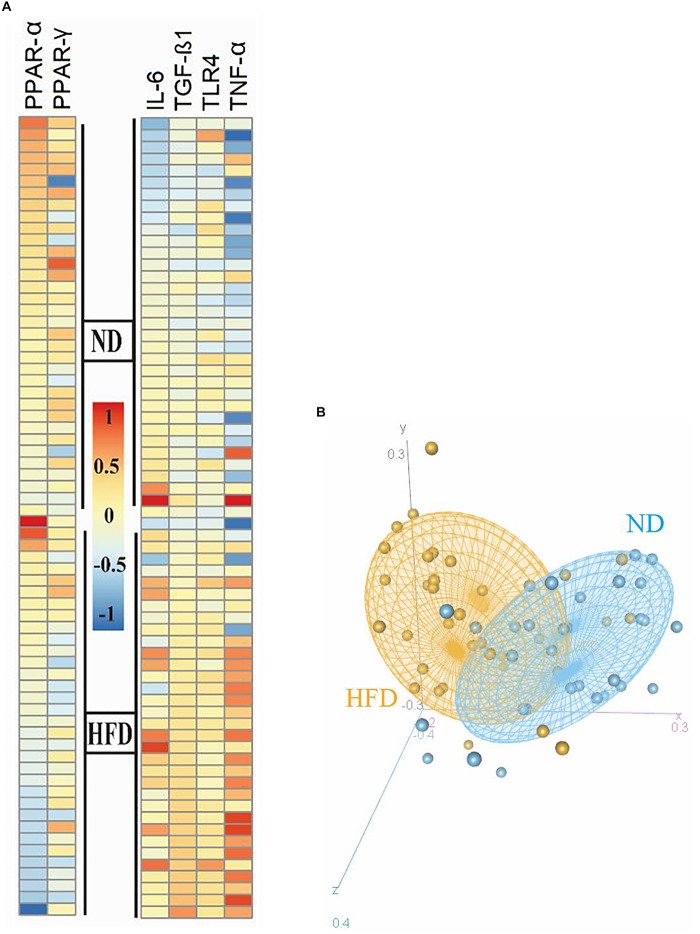
FIGURE 2.
Heatmap and PCA correlation show different genes involved in inflammation and FA oxidation in the epididymal adipose tissue between HFD and ND mice. (A) Heatmap plot revealed inflammatory genes (TNF-α, IL-6, and TLR-4) and TGF-β were expressed at significantly higher levels in the obese than in the normal group. (B) Regulator genes involved in FA oxidation and inflammation (PPAR-γ and PPAR-α) were downregulated in HFD- compared to ND-fed mice. PCA plot showed that the ND group was clustered relatively from the HFD group. The HFD and ND groups are indicated by orange and blue colors, respectively.

