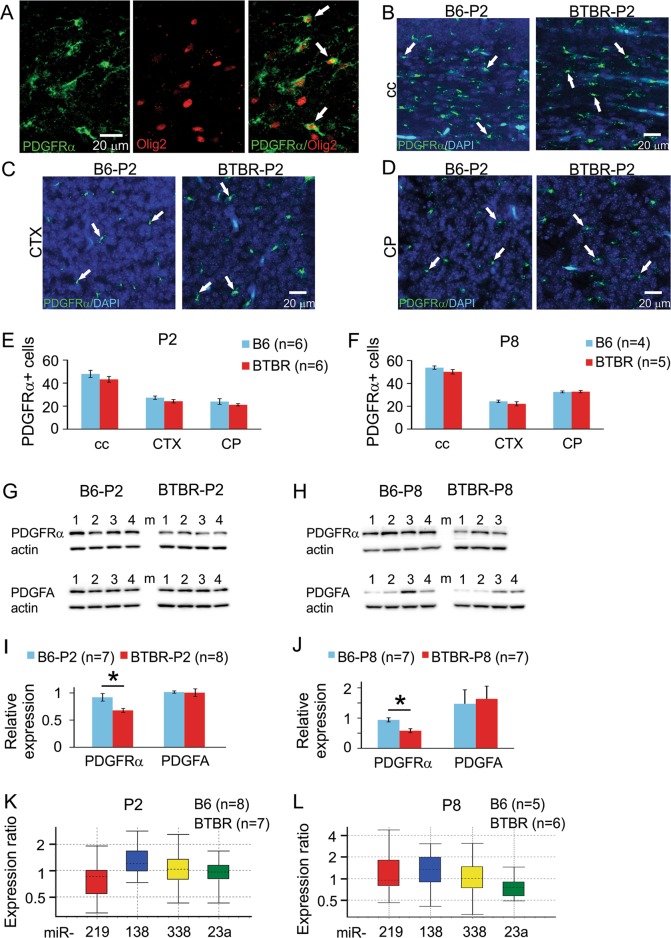
Fig. 5. PDGFRα signaling was reduced in neonatal frontal brain of the BTBR mice.
a Co-immunofluorescence staining of PDGFRα and Olig2 showed that PDGFRα-positive cells also expressed Olig2, another marker for oligodrendroglial lineage. White arrows indicate examples of cells that are positive for both PDGFRα and Olig2. b–d PDGFRα and DAPI co-staining for cell counting purpose in the corpus callosum (cc), somatosensory cortex (CTX), and striatum (CP). White arrows indicate examples of cells that are positive for PDGFRα. e, f Quantification of PDGFRα-positive cells at both P2 and P8 in the three brain regions. g, h Western blots showing the protein expression levels of PDGFRα and PDGFA at both P2 and P8. i, j Quantification of western blot results indicated that relative expression levels of PDGFRα were significantly reduced in the BTBR compared with the B6 mice at both P2 and P8, while relative expression levels of PDGFA were similar between the two strains of mice at both ages. k, l Relative levels of miR-219, 138, 338, and 23a in striatal homogenates from P2 and P8 mice, presented as a ratio of BTBR to B6 levels

