Figure 1.
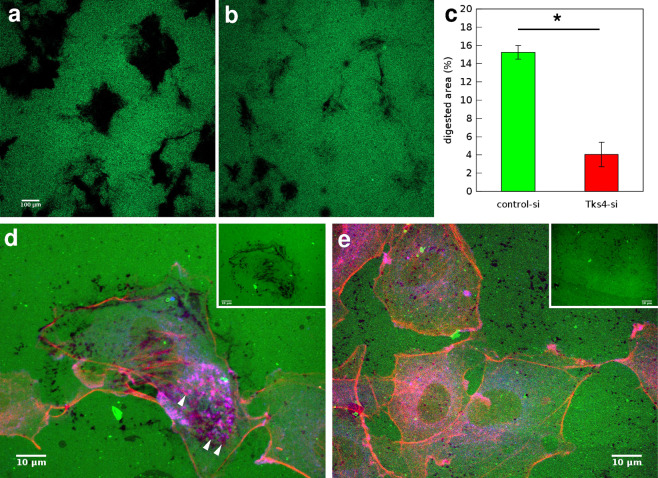
Gelatin degradation assay. (a,b) Representative fluorescent images of microscopic fields where HUVEC cells transfected with control-siRNA (a) or Tks4-siRNA (b) and seeded at the same cell density digested fluorescent OregonGreen488-conjugated gelatin substrate for 20 hours. Dark areas correspond to cleaved substrate. Scale bar: 100 μm. (c) Quantitative analysis of digested areas from n = 3 independent sets of experiments. Error bars are SEM, asterisk (*) indicates statistically significant difference with Student’s t-test, . (d,e) HUVEC cells transfected with control-siRNA (d) or Tks4-siRNA (e) and seeded on fluorescent OregonGreen488-conjugated gelatin substrate (green) for 5 hours were immunolabeled with anti-cortactin antibody (blue) and stained with phalloidin-TRITC to visualize F-actin (red). Arrowheads in d point to cortactin positive podosome structures. For better identification of areas with increased proteolytic activity, insets in d and e show the corresponding green fluorescent channel only. Scale bars: 10 μm.

