Figure 8.
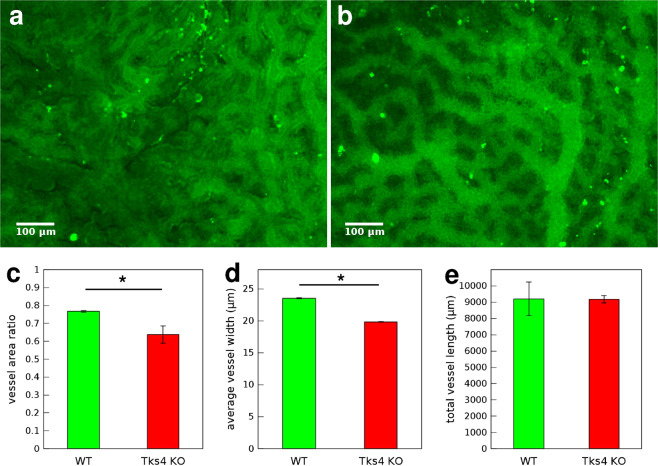
Chorion vessel analysis. Representative fluorescent microscopic images of chorions from (a) WT or (b) Tks4-KO embryos where endothelial cells were visualized by CD34 immunofluorescent labeling (green), scale bar: 100 μm. Quantitative analysis of vessel parameters in 3 WT and 3 Tks4-KO individuals: (c) vessel density, (d) average width of vessels, (e) total length of all vessels in a 865 μm × 650 μm microscopic field. Error bars correspond to SEM and asterisks (*) indicate statistically significant differences with Student’s t-test, .

