Figure 3.
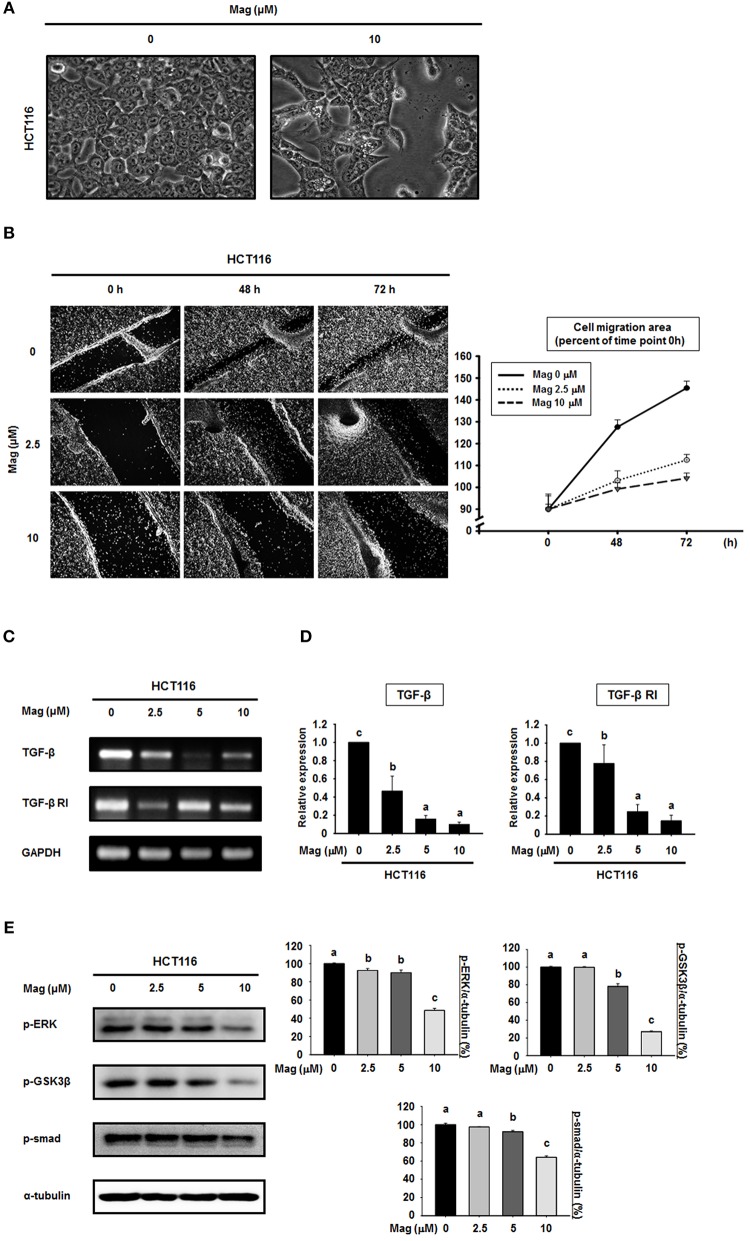
Cell migration is suppressed and the TGF-β signaling pathway is blocked in HCT116 cells by magnolol. (A) The morphological changes in HCT116 cells treated with or without magnolol (10 μM). Images were taken at 48 h after treatment using a microscope. (B) Confluent monolayers of HCT116 cells were scratched using a pipette tip prior to treatment with 0, 2.5, or 10 μM magnolol. The area of migration was measured at 0, 48, and 72 h. Photographs were taken at 48 and 72 h after cell seeding using a microscope. The area quantified using ImageJ, and the data was normalized to the average of 0 h values. (C) RT-PCR analysis of TGF-β and TGF-β RI expression in HCT116 cells treated with (0, 2.5, 5, or 10 μM) for 24 h. GAPDH was used as control. (D) Quantitative RT-PCR analysis of TGF-β and TGF-β RI expression in HCT116 cells treated with (0, 2.5, 5, or 10 μM) for 24 h. The graphs show the mRNA expression of TGF-β and TGF-β RI relative to GAPDH. (E) HCT116 cells were treated with the indicated concentrations of magnolol for 24 h, and western blots were performed for p-ERK, p-GSK3β, p-Smad, and α-tubulin. Data values labeled with different letters are significantly different (p < 0.05).

