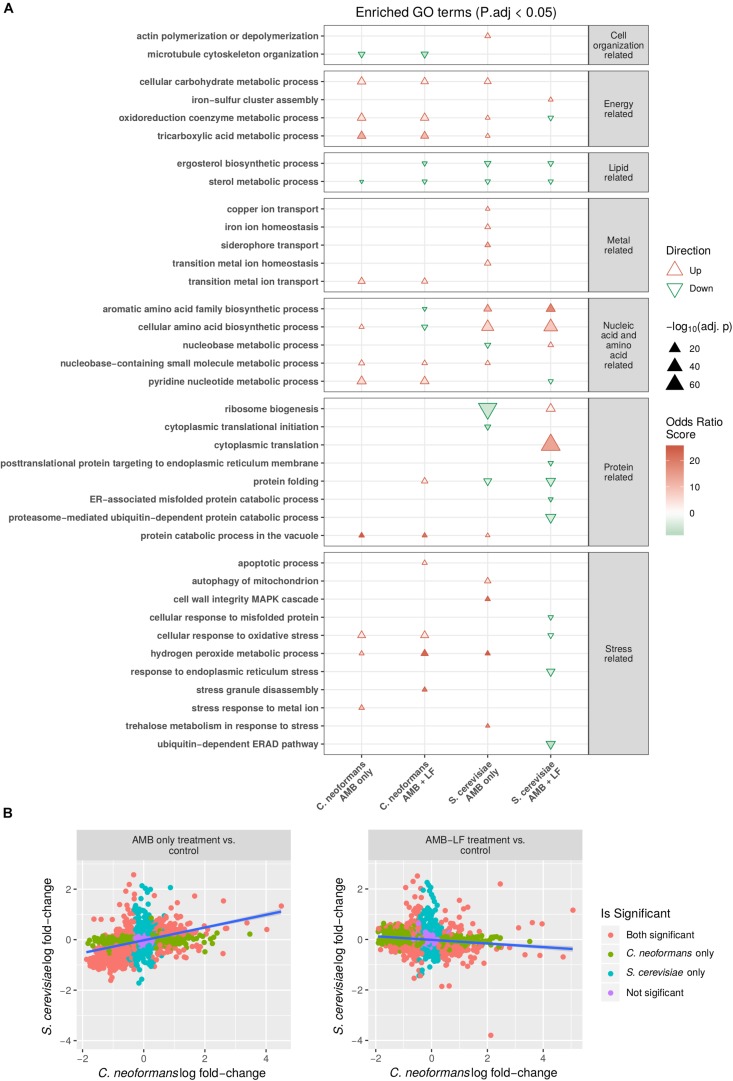
FIGURE 1.
Transcriptomic and functional enrichment analyses highlight differences in the biological processes affected by AMB-LF synergy in Cryptococcus neoformans and Saccharomyces cerevisiae. (A) Enriched biological process GO terms based on differentially expressed genes in C. neoformans and S. cerevisiae in response to AMB and AMB-LF treatments. A subset of the enriched GO terms are listed on the y-axis, and similar GO terms are placed into groups including cell organization and replication-related, energy-related, lipid-related, metal-related, nucleic acid- and amino acid-related, protein related, and stress-related. The AMB and AMB-LF treatments in C. neoformans and S. cerevisiae are shown on the x-axis. Overall increased or decreased expression of each GO terms is indicated by a red triangle or green inverted triangle, respectively, with the size of the triangle scaled to represent the negative log adjusted p-value that shows the significance of the genes contributing to an enrichment relative to the total population of genes. Intensity of colors within the triangles indicate the magnitude of the odds ratio score, which represents the significance of the number of genes contributing to an enriched GO term. The two fungi responded to drug treatment quite differently, and in particular the synergy related to AMB-LF treatment induced opposite gene expressions for a number of processes, particularly protein folding and response to oxidative stress. (B) Comparison of the change in expression of genes mapped to protein sequence orthologs in S. cerevisiae and C. neoformans. Orthologs were defined as pairs of proteins with best hits from the reciprocal BLASTp searches of proteins from one organism to the proteome sequences of the other. The y-axis shows the log fold-change of S. cerevisiae ortholog transcripts, and the x-axis indicates the log fold-change of C. neoformans ortholog transcripts. Colored points indicate genes corresponding to protein orthologs that are significantly differentially expressed in both organisms (orange), C. neoformans only (green), S. cerevisiae only (blue), or not significant in either organism (purple). Linear trend is shown by a blue line. A significant positive correlation is seen for the AMB treatment (left) (ρ = 0.38, p-value < 0.05) while a negative correlation is seen for the AMB-LF treatment (ρ = –0.13, p-value < 0.05), suggesting synergy is mediated by different mechanisms in the two organisms.

