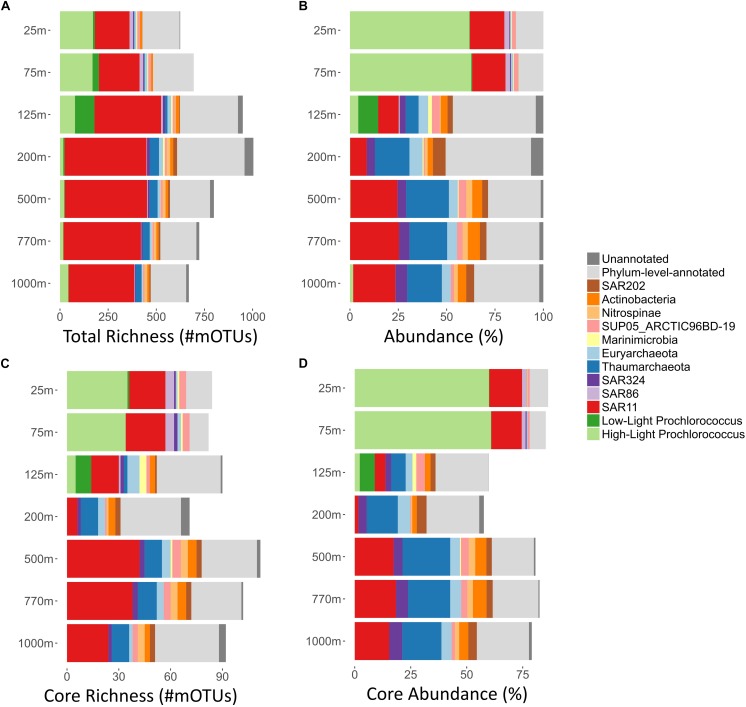
FIGURE 1.
Summary of per-depth core richness, total richness, average abundances, and core abundances, of major bacterial and archaeal clades at Station ALOHA. For each depth (y-axis; 25–1000 m), major bacterial and archaeal clades are displayed. mOTUs that could be annotated at only the phylum level (light gray) and those that were not annotated to any known taxonomic clade (dark gray) were summarized, respectively. (A) Total richness of different microbial clades was calculated as described in methods and displayed as bar charts. Total richness is the number of mOTUs present in at least one sample, in any given depth. (B) Clade% abundances based on COG0012 mOTU abundances were first summed on a per sample basis, and then averaged across all samples of each depth. The bar charts display the total abundance in percent of the whole community for each clade at each given depth. (C) Core-mOTU richness of different microbial clades was calculated as described in methods and displayed as bar charts. In short, core-mOTU richness is the number of core-mOTUs that are present in every sample taken at a given depth. (D) Summary of per-depth average core-mOTU% abundances (of the whole community) for different bacterial and archaeal clades. For each sample core abundances were calculated as sums of the abundances (percent of the whole community) of COG0012 core-mOTUs for every bacterial and archaeal clades. Subsequently, the mean average across all samples of each depth was calculated.

