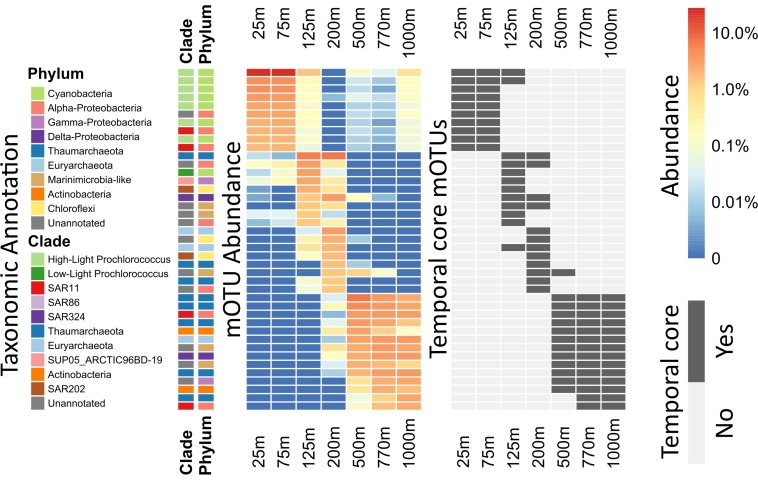
FIGURE 3.
Heatmap of per-depth average abundances and core depths for highly abundant mOTUs. For each mOTU, the average across all samples of each depth was calculated. The 10 most abundant mOTUs for every depth were calculated and plotted in descending order. Side bars (on the left) show taxonomic annotations to major marine bacterial and archaeal phyla and clades. Left, the heatmap colors display the logarithm of the percent abundance of the whole community, for each clade at each given depth. Right, the heatmap indicates whether or not the displayed mOTUs are core-mOTUs for each depth. An extended abundance heatmap of this figure is available (Supplementary Figure S4).

