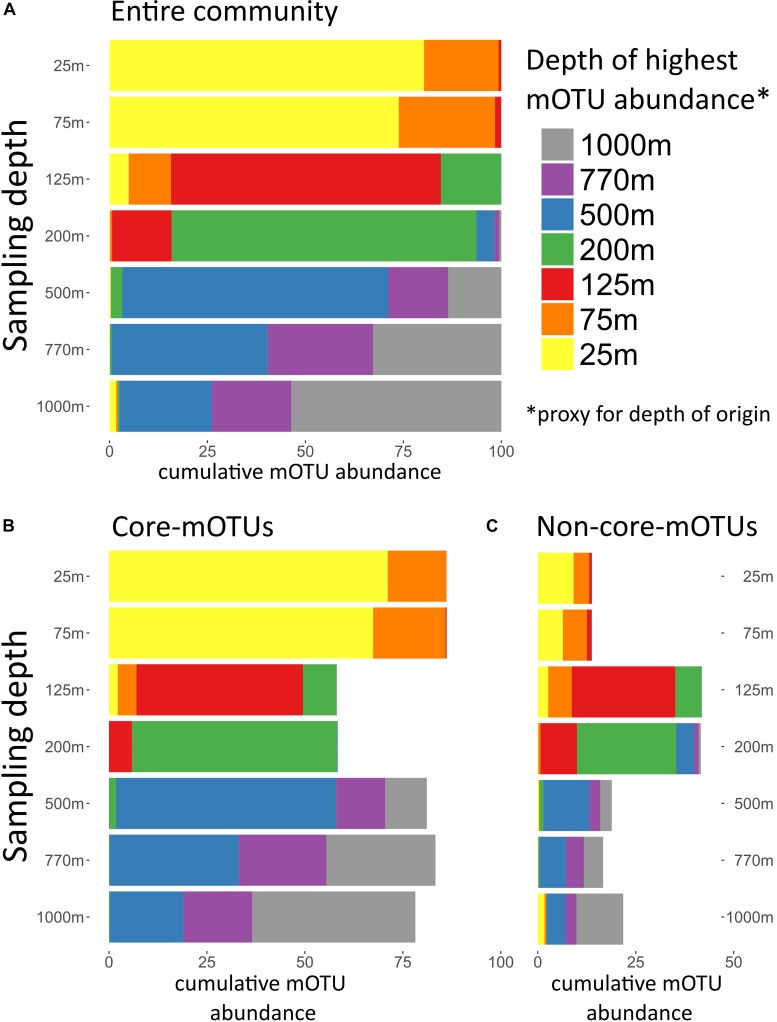
FIGURE 4.
Depth of highest mOTU abundance. Depth of highest mOTU abundance which can be interpreted as a proxy for depth of origin. For every mOTU the depth of highest relative abundance was determined, and mOTUs with the same depth of highest abundance were summed. For each sampled depth, the cumulative abundance of mOTUs assigned to a depth of highest abundance was displayed in different colors. (A) Total community, (B) only core-mOTUs, and (C) only non-core-mOTUs.

