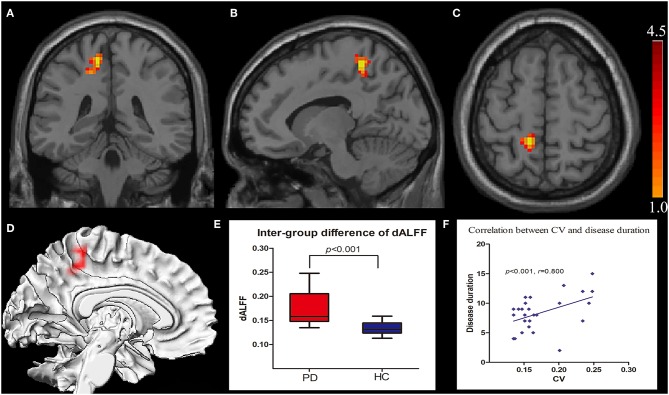
Figure 1.
Increased CV of dALFF in the left precuneus displayed in coronal (A), sagittal (B), transverse (C), and three-dimensional view (D). Box plots with Whiskers (min–max) show the CV values in the left precuneus of the two groups (E), and scatterplots show the relationship between the CV in the precuneus of the PD group and the disease duration (F). CV, coefficient of variation; dALFF, dynamic spontaneous low-frequency fluctuation.

