
Figure 2.
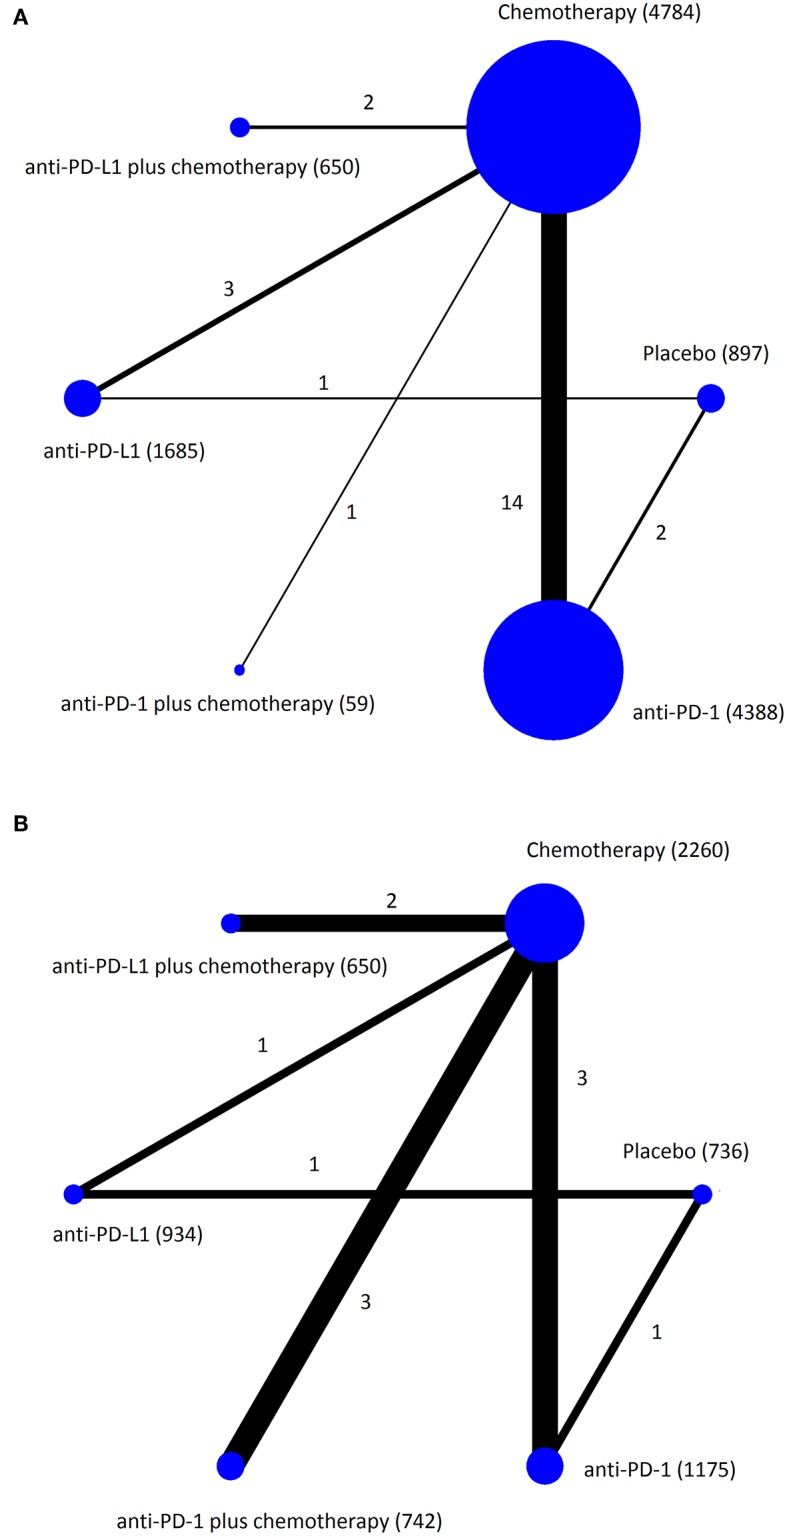
Network plots of eligible comparisons for the Bayesian network meta-analysis. The size of the nodes is proportional to the number of patients (in parentheses) randomized to receive the treatment. The width of the lines is proportional to the number of comparisons (beside the line) comparing the connected treatment (nodes). A total of 23 comparisons were analyzed for treatment-related adverse events (A); a total of 11 comparisons were analyzed for immune-related adverse events (B).