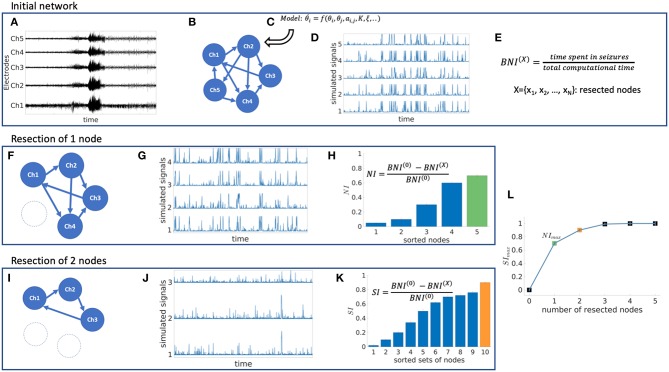
Figure 1.
Schematic representation of the mathematical framework. From intracranial recordings (A) we construct a functional network (B). We then place a mathematical model on each node (C), simulate signals from the model (D) and calculate brain network ictogenicity (E). Then perturbations are applied to the network by removing individual nodes (F) or set of nodes (I). Using the simulated signals from the perturbed networks (G,J), Node Ictogenicity (NI) and Set Ictogenicity (SI) are calculated for all possible combinations of resected nodes [panels (H,K), respectively]. Finally, for every number of resected nodes the set that contributes most to the seizure generation is the one with the maximum SI (H,K,L). (L) Illustrates the SI of the most ictogenic sets split out by resection size.

