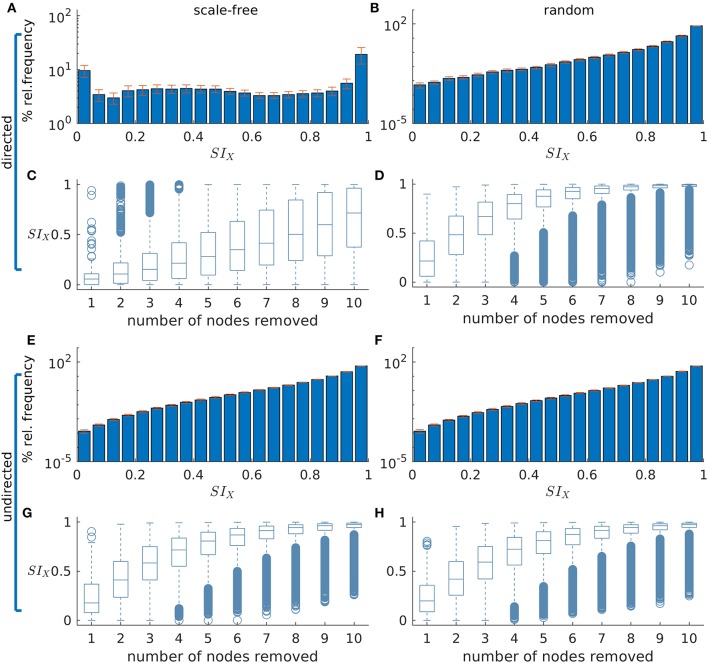
Figure 2.
The distribution of Set Ictogenicity (SI) depends on network topology and resection size. (A,B) display the average SI distribution for ten directed artificial scale-free (A) and random (B) networks, respectively. Error bars denote the standard error across the ten network realizations. (C,D) show SI distributions split out by resection size (i.e., number of nodes removed) for the networks of panels (A) and (B), respectively. (E–H) are similar to (A–D), but for undirected networks. Parameters: network size N = 20; in the directed networks the in and out degree is 2, whilst in the undirected the mean degree is 2; scale-free degree distribution exponent γ = 3. The horizontal line in each boxplot indicates the median, while the bottom and top edges of each box are the 25th and 75th percentiles, respectively. The whiskers denote the range and circles the outliers.

