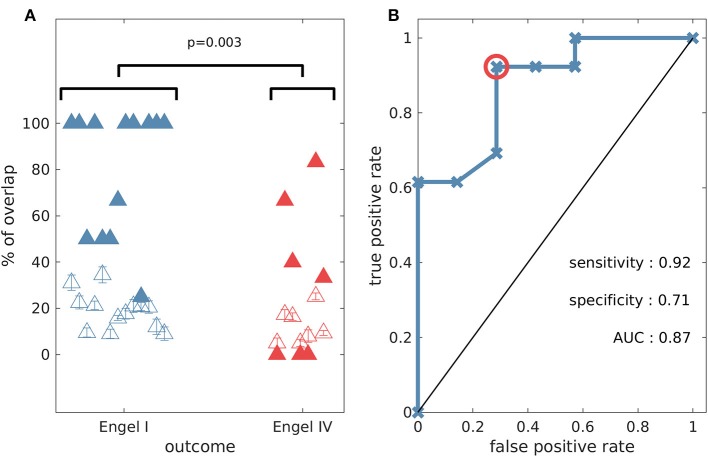
Figure 7.
The percentage overlap between actual resections and model predictions is higher for patients with good outcome compared to those who had poor post-surgical outcome (one-sided Wilcoxon rank sum test p = 0.003). (A) Percentage overlap vs. patient surgical outcome grouped by Engel class (filled triangles). The unfilled triangles correspond to an average overlap between actual resections and equal-size random resections (100 random samples, and the error bars denote the standard error). (B) Receiver operating characteristic (ROC) analysis for Engel I (seizure free patients) vs. Engel IV (non-seizure free patients) using the percentage overlap as the classifier. The red circle indicates the point that is used for the calculation of sensitivity and specificity. Parameter setting for the genetic algorithm: population size equal to 200 and number of generations equal to 150.

