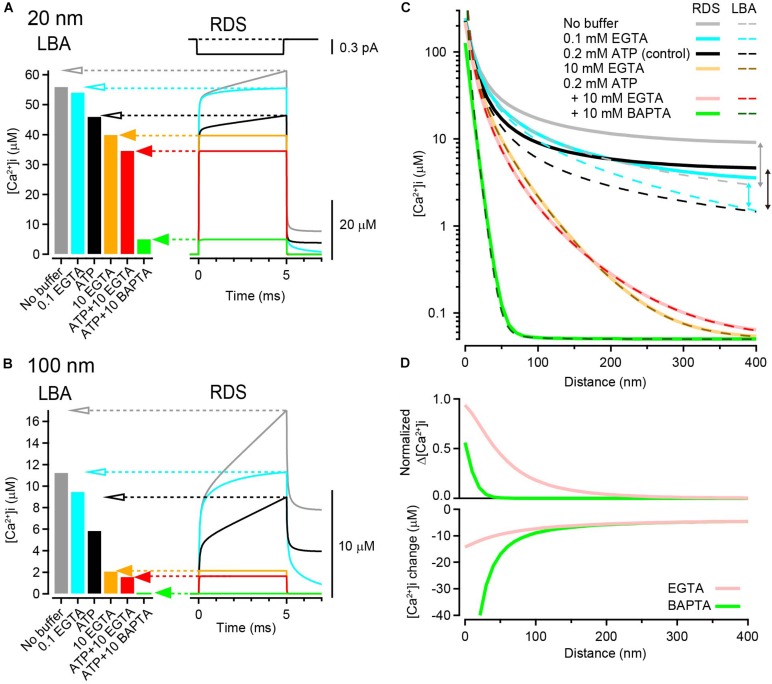
FIGURE 1.
Calculation of [Ca2+]i gradients around an open VGCC. (A) left, [Ca2+]i at 20 nm from the VGCC calculated using LBA under various buffer conditions. Single channel current amplitude was 0.3 pA. Right, Time dependent [Ca2+]i changes calculated using RDS. Channel open duration was 5 ms (top). Under heavily buffered conditions, both estimates agreed (filled arrows), whereas under the weak or no-buffer conditions, LBA predicted lower [Ca2+]i than the peak [Ca2+]i of transients in RDS (open arrows). Resting [Ca2+]i was 50 nM. (B) Same as (A) but at 100 nm from the VGCC. (C) Spatial gradients of [Ca2+]i from LBA (dashed) and RDS (solid) in various buffer conditions. The vertical arrows indicate discrepancies between the two estimates. (D) Reduction of [Ca2+] by 10 mM EGTA (pink) and BAPTA (green) against distance. Top, the reduction is represented as the ratio of the peak [Ca2+]i in the presence of the chelator to that in the control (0.2 mM ATP). Bottom, the reduction is represented as the difference between the peak [Ca2+]i in the presence of the chelator and that in the control.

