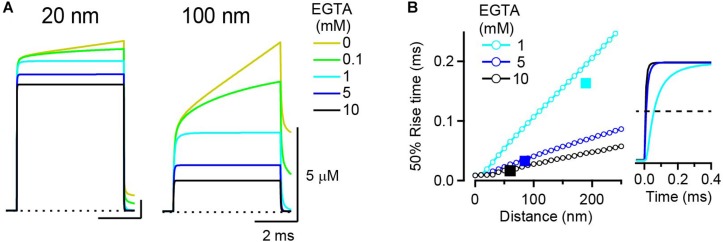
FIGURE 2.
Rise kinetics of [Ca2+]i transients. (A) [Ca2+]i transient at 20 nm (left) and 100 nm (right) from a VGCC in the presence of various concentrations of EGTA. Single VGCC current was 0.3 pA in amplitude and 5 ms in duration. (B) Relationship between [Ca2+]i transient kinetics and the distance; 50% rise time of [Ca2+] transients from RDS in the presence of 1, 5, and 10 mM EGTA was plotted against voxel distance from the VGCC. For comparison, the time constant [τ (ms)] from LBA plotted against the space constant [λ (nm)] for each EGTA concentration is denoted as a filled square. Traces in the right panel represent [Ca2+]i transients (normalized with amplitude) at the voxel closest to the distance λ (190 nm for 1 mM; 80 nm for 5 mM; 60 nm for 10 mM EGTA). Horizontal dashed line denotes 50% rise of the transients.

