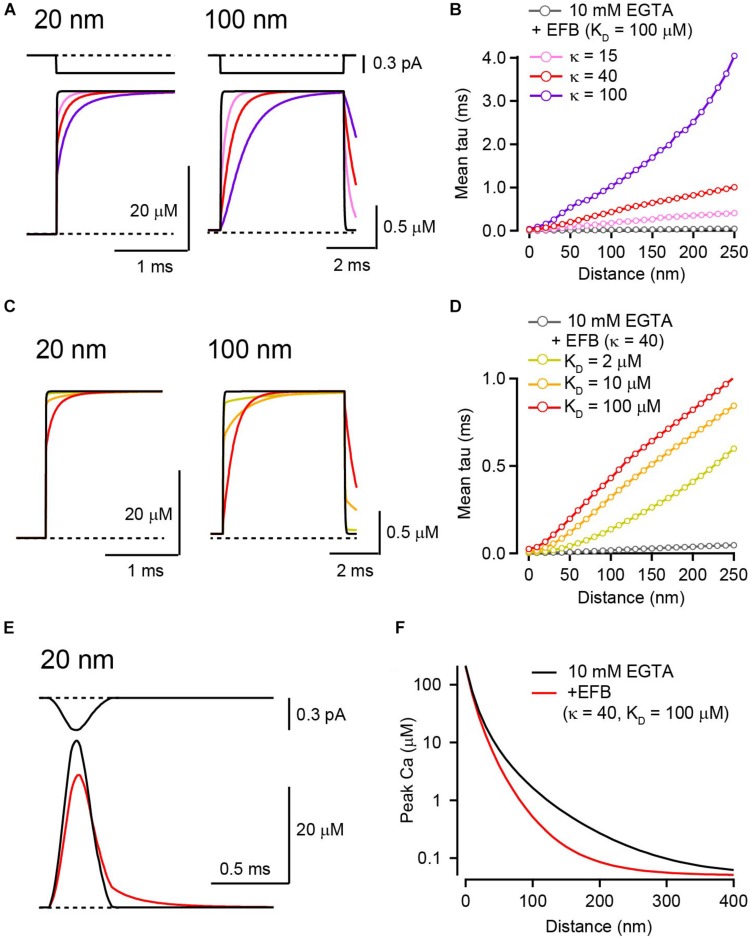
FIGURE 3.
The effect of EFB on [Ca2+] transients in the presence of 10 mM EGTA. (A) Ca2+ current through a VGCC (top) and the resultant [Ca2+]i transients for 20 nm (left) and 100 nm (right) distances in the presence of EFB with various κ values. I tested κ of 15 (pink), 40 (red), and 100 (purple) by altering EFB concentration. KD was 100 μM. (B) Mean rise times of [Ca2+] transients for different EFB κ values were plotted against voxel distance. (C) [Ca2+] transients for 20 nm (left) and 100 nm (right) distances with various affinities of EFB. We tested KD of 2 (yellow), 10 (orange), and 100 (red) μM. κ was set at 40. Black and red traces are identical to those in (A). (D) Mean rise times of [Ca2+] transients for different EFB affinities. (E) Action potential-evoked [Ca2+] transients 20 nm from VGCC in the absence (black) and presence (red) of EFB. The current waveform (top) was obtained from whole-presynaptic terminal Ca2+ current at the calyx of Held evoked by action potential waveform voltage command and scaled to 0.3 pA. (F) Spatial gradients of peak [Ca2+] transients evoked by an action potential in the presence of low-affinity EFB.

