
Figure 3.
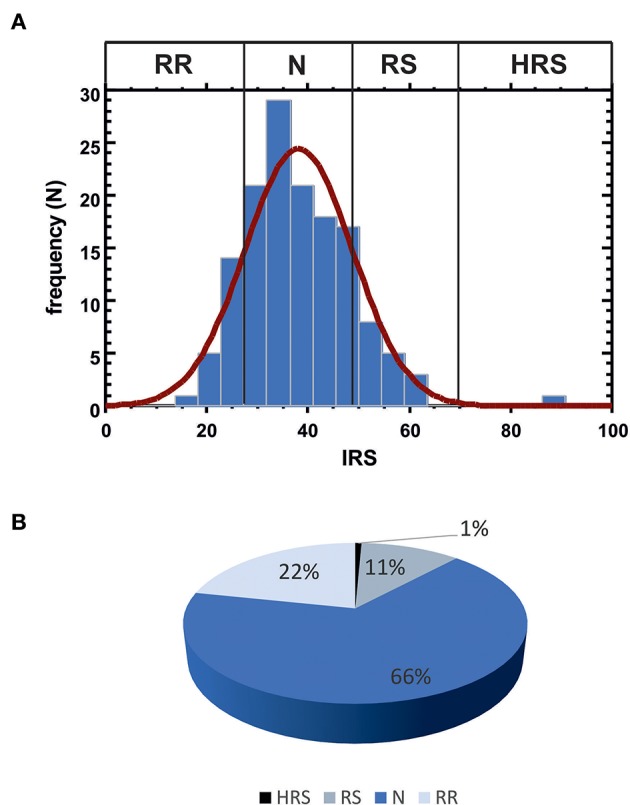
(A) Data distribution for IRS values. Vertical lines indicate the observed thresholds for the 4 classes of individual radiosensitivity, calculated as: RR, mean - SD (IRS < 27.48); N, mean ± SD (27.48 ≤ IRS ≤ 48.72); RS, mean + SD (48.72 < IRS ≤ 69.96); HRS, mean + 3 SD (IRS > 69.96). (B) Patient distribution according to the four IRS classes.