Figure 2.
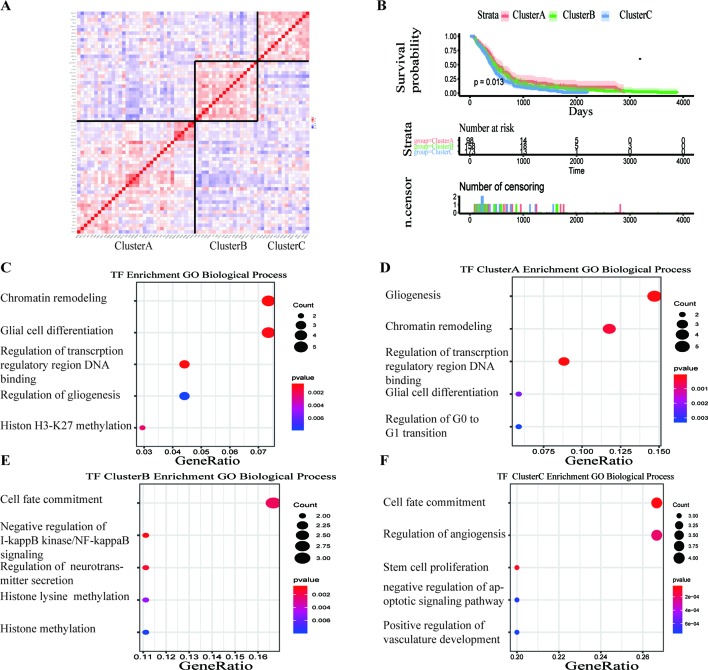
Survival analysis and gene function enrichment of Clusters A–C. (A) Gene expression correlation of Clusters A–C in The Cancer Genome Atlas (TCGA) glioblastoma (GBM) data. (B) Survival analysis of the three groups, Clusters A–C: the patients in Cluster A had the best prognosis, while those in Cluster C had the worst prognosis. (C) Gene Ontology (GO) (biological process) enrichment results of 68 transcription factors. (D–F) GO (biological process) enrichment results of Clusters A–C.

