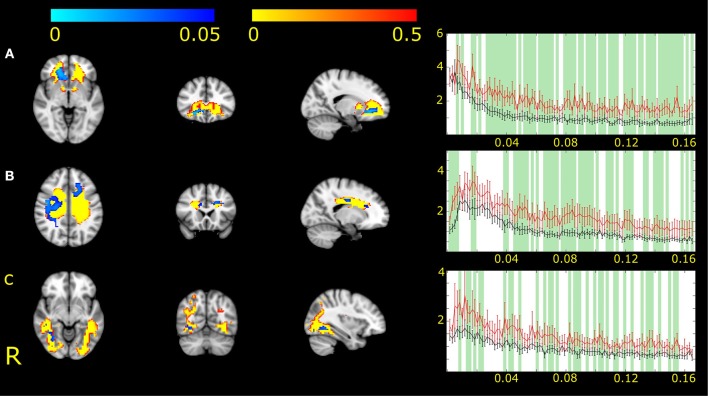
Figure 1.
Three white matter functional networks (IC2, A; IC7, B and IC17, C) had different expression in MWA and MWoA. Higher expression and amplitude was found in the case of MWA. The white matter functional networks are depicted in red-to-yellow thresholded to 0.5 probability. The group differences between MWA and MWoA is shown in blue-to-light blue thresholded at p < 0.05. The colorbar represents p-values. The group average Fourier spectrum presented next to the spatial maps. The red line represents MWA, the black MWoA. Green columns showed frequency values that different significantly between the two groups (p < 0.05).

