
Figure 3.
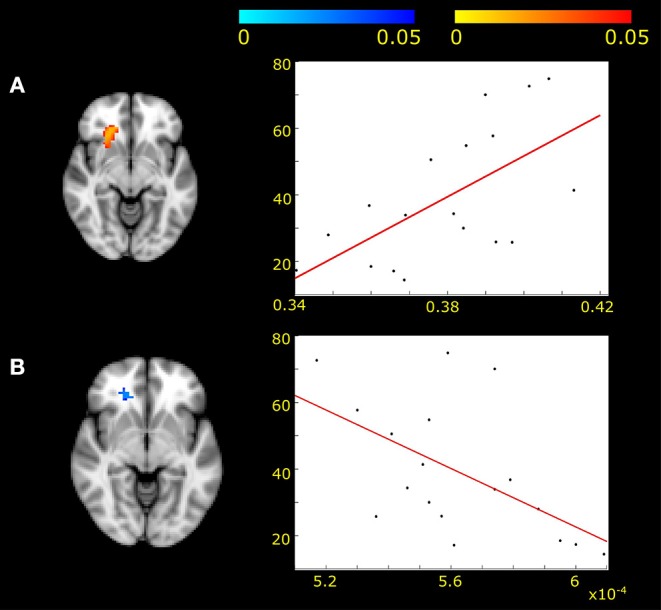
Positive correlation was found between fractional anisotropy and frontal white matter activity fluctuations (A) (p < 0.05, corrected for multiple correlations) in MWA patients. Negative correlation was found between radial diffusivity and frontal white matter activity in the same area (B) (p < 0.05). The x axis represents the diffusion values of FA (A) and RD (B). The y axis shows the z-scores under the specified area.