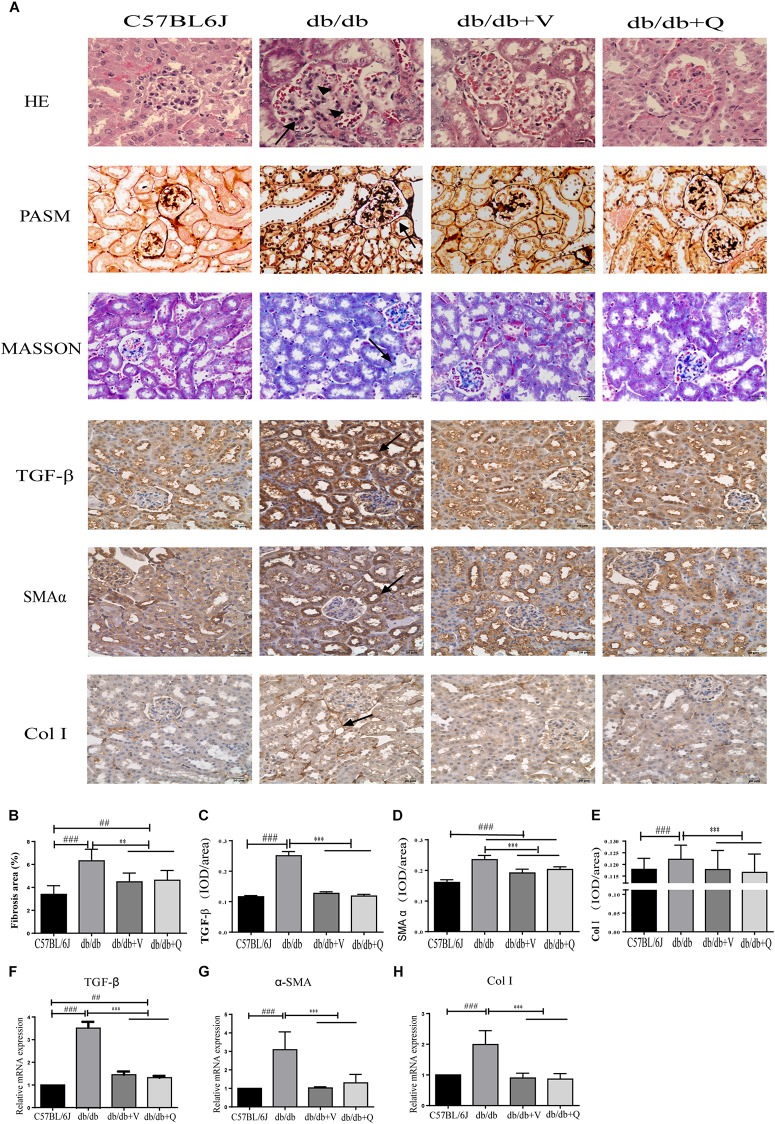
FIGURE 2.
QDTS alleviated renal histological injury. (A) HE staining, Masson’s trichrome staining, PASM staining of renal tissues, and immunohistochemical staining for TGF-β, α-SMA, and Col I, respectively. (B) Degree of renal fibrosis. Imagine Pro Plus software was used to calculate results (the area of the blue area in each slice multiplied by its average optical density), which were compared between groups. (C–E) Are the statistic results of immunohistochemical staining of TGF-β, α-SMA, and Col I, respectively. The value of mean optical density (total optical density/total area) obtained by Imagine Pro Plus software. (F–H) Are the RT-qPCR statistic results of mRNA of TGF-β, α-SMA, and Col I, respectively. ∗∗p < 0.01 and ∗∗∗p < 0.001: compared with the model group, respectively; ##p < 0.01 and ###p < 0.001: compared with the normal control group, respectively. In the db/db group, glomerular mesangial hyperplasia (arrowheads) with mononuclear infiltration (arrow) was observed in HE staining, and the positive parts of other lesions are also marked with arrows.

