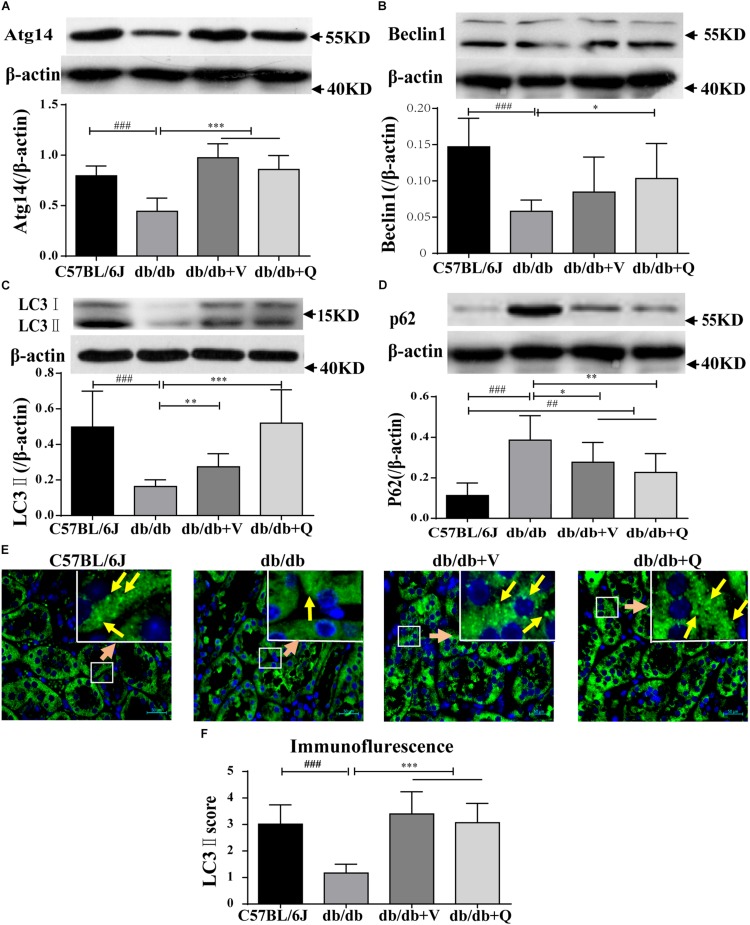
FIGURE 4.
Renal autophagy| activity of db/db mice was activated by QDTS. (A–D) Are the expression of Atg14, Beclin1, LC3-II, and p62, respectively; (E) is the staining result (400x) of LC3-II immunofluorescence of paraffin sections. The small soft highlights in the figure are the specific expression of LC3-II, which was blindly reviewed and given a score by three pathologists, according to the quantity from least to greatest (score 0–5) divided into five levels. The results of evaluation are shown in (F). ∗p < 0.05, ∗∗p < 0.01, and ∗∗∗p < 0.001: Compared with the model group, respectively; ##p < 0.01 and ###p < 0.001: compared with the normal control group, respectively.

