FIGURE 5.
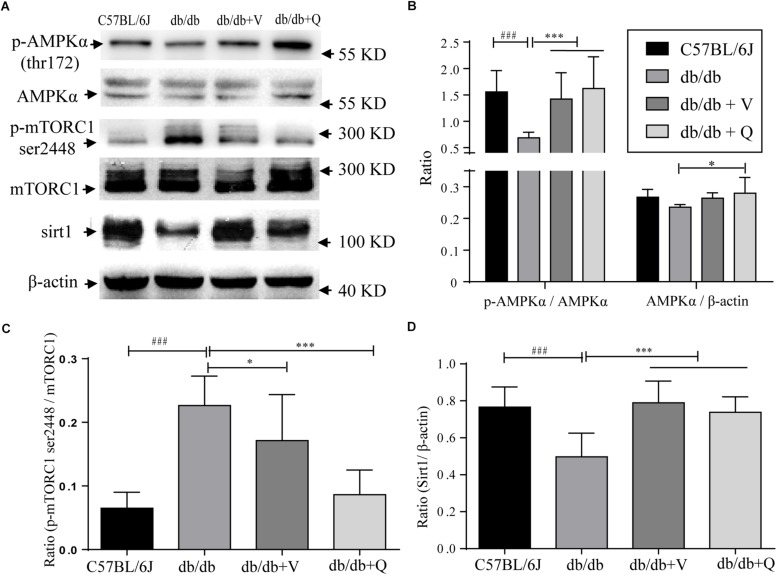
Nutrient-sensing signal molecules were ameliorated by QDTS. (A) Is a collection of protein bands. (B) Shows the effect of drug intervention on total AMPK protein and the level of p-AMPK thr172/AMPK in the kidney. (C) Shows the effect on the level of mTORC1 ser2448/mTORC1. (D) Indicates the expression of SIRT1 in the kidney. ∗p < 0.05 and ∗∗∗p < 0.001: Compared with the model group, respectively; ###p < 0.001: compared with the normal control group.

