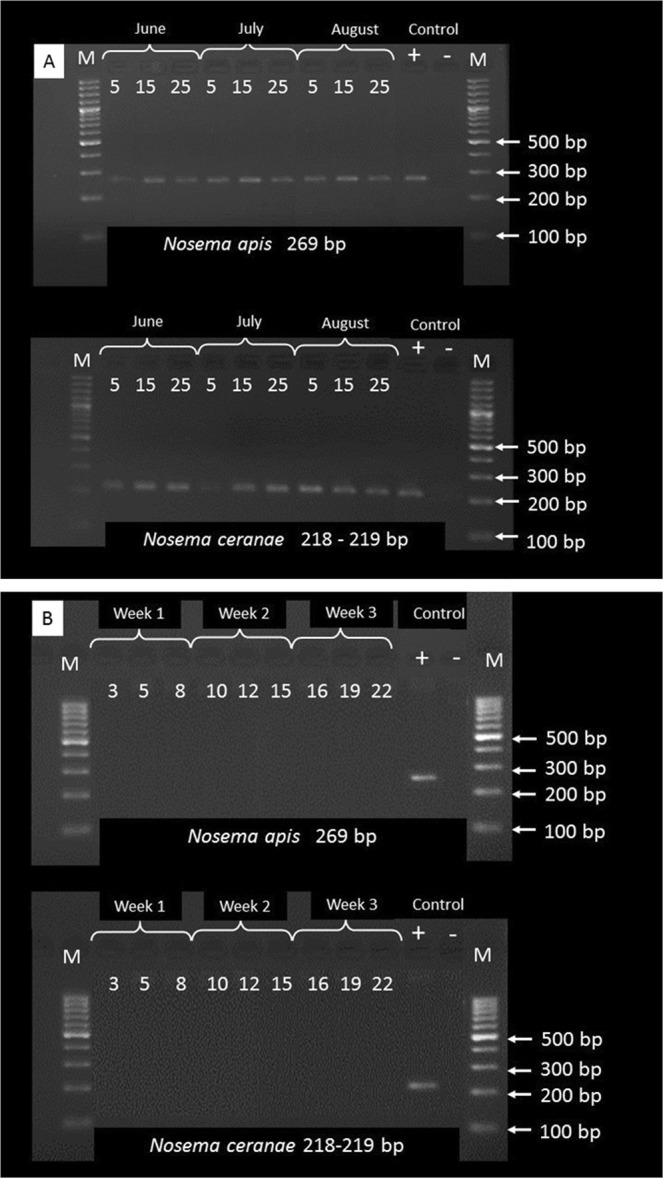
Figure 2.

Experimental procedures. (A) 2% agarose gels showing PCR products amplified from Nosema ceranae and Nosema apis DNA extracted from the spores captured on apiary tapes. M: Molecular weight marker (Gene ruler, 1-kb ladder, Thermo Scientific). Lanes 5–25 correspond to the experimental days represented by the tape fragments selected for the PCR analysis. (B) 2% agarose gels showing absence of PCR products amplified from Nosema ceranae and Nosema apis DNA extracted from the spores captured on tapes from the air in the Botanical Garden. M: Molecular weight marker (Gene ruler, 1-kb ladder, Thermo Scientific). Lanes 3–22 correspond to the experimental days represented by the tape fragments selected for the PCR analysis.
