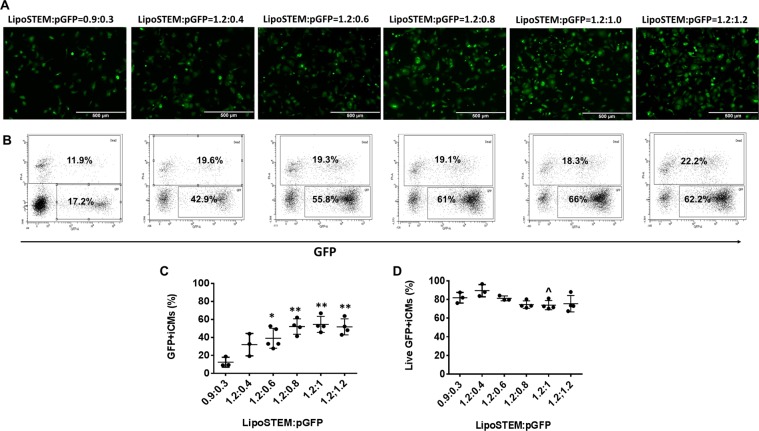
Figure 8.
LipoSTEM based pGFP transfection with hiPSC-CMs at transfection ratios of 0.9:0.3, 1.2:0.4, 1.2:0.6, 1.2:0.8, 1.2:1, and 1.2:1.2 on day 25 of contraction. (A) Representative images of GFP expression in hiPSC-CMs on day 25 of contraction. (B) Representative flow cytometry results to show transfection efficiency and cell death. Mean transfection efficiency (C) and cell viability (D) of LipoSTEM based hiPSC-CMs transfection with pGFP. (Data are represented as mean ± SD) (** vs 0.9:0.3: p < 0.01, *** vs 0.9:0.3: p < 0.001, and ^ vs 1.2:0.4: p < 0.05).

