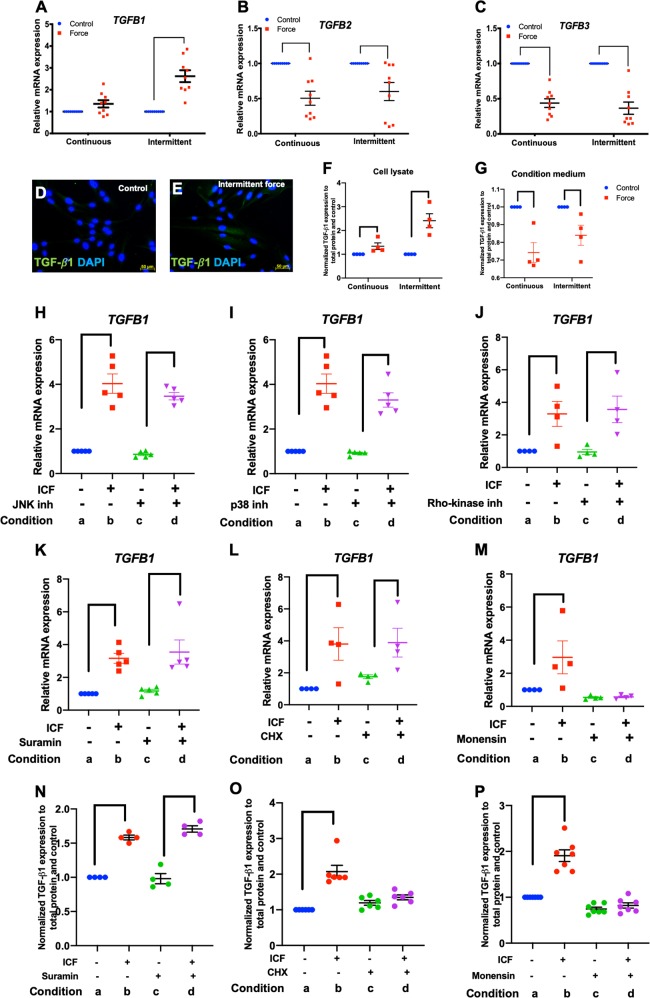
Fig. 6. ICF induced TGF-β1 expression.
Cells were treated with CCF or ICF in serum-free media for 24 h. Cells cultured in the same condition without mechanical force application were used as the control. Experimental conditions were illustrated in Fig. 2a. The mRNA expression of TGFB1 (a), TGFB2 (b), and TGFB3 (c) was evaluated using real-time polymerase chain reaction. TGF-β1 protein expression was examined using immunofluorescence staining (d, e) and enzyme linked immunosorbent assay (f, g). To investigate the regulatory pathways, cells were pretreated chemical inhibitor 30 min prior to ICF treatment. Experimental conditions were illustrated in Fig. 2i. Chemical inhibitors were JNK inhibitor (h), p38 inhibitor (i), Rho-kinase inhibitor (j), suramin (k, n), cycloheximide (l, o), or monensin (m, p). TGFB1 mRNA and protein levels were examined using real-time polymerase chain reaction and enzyme linked immunosorbent, respectively. Bars indicate a significant difference between conditions. ICF intermittent compressive force treatment, CHX cycloheximide. Scale bars indicate 50 μm

