Fig. 2.
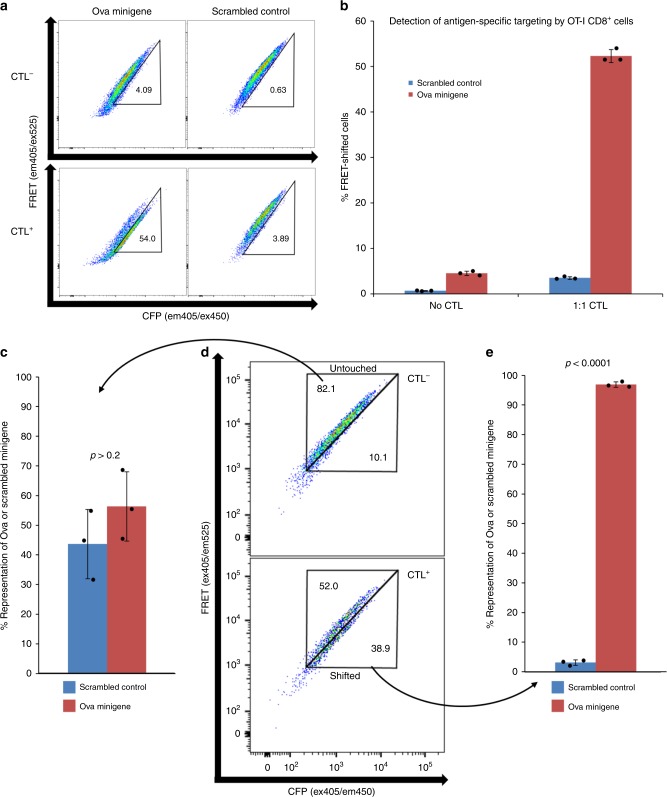
FRET-shift assay testing. a, b ID8 cells expressing either the Ova minigene fragment with native epitope intact (OVAL241-280) or the Ova minigene containing a scrambled epitope (OVAL257-264 SIINFEKL → LKNFISEI) were cultured with or without OT-I CD8+ T cells at a 1:1 ratio for 4 h. a Representative plots of FRET signal (ex405/em525) vs. CFP signal (ex405/em450) and (b) proportions of cells shifting into Targeted gate in all replicates (n = 3, underlaid bar chart and error bars denote mean ± SD) are shown. Significance was determined using an unpaired, one-tailed Student’s t test. Effect size was calculated as the difference of standardized means (Cohen’s effect size). c–e Ova minigene-expressing targets or scrambled control cells were combined at a 1:1 ratio to form a binary mixed target population. Mixed targets were co-incubated with OT-I CTL for 4 h at 1:1 effector:target ratio prior to FACS analysis in triplicate for all conditions (underlaid bar chart and error bars denote mean ± SD). Recovered cells were lysed, and genomic DNA was purified and used as a template for qPCR using a custom TaqMan assay. Significance was determined using an unpaired, one-tailed Student’s t test. Source data are provided as a Source Data file

