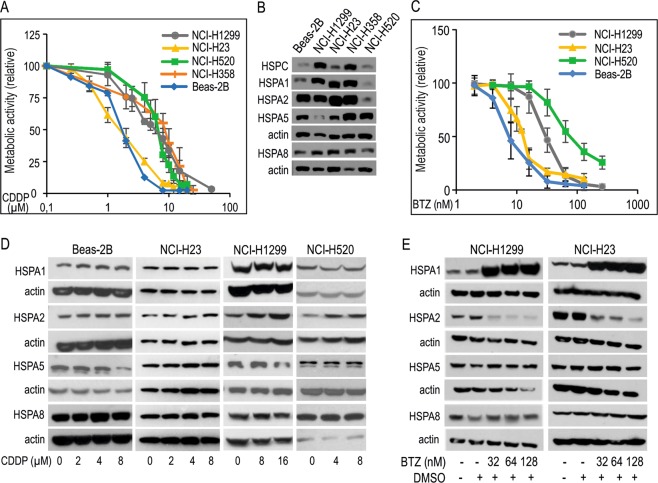
Figure 1.
Dose response curves of cisplatin (CDDP) and bortezomib (BTZ) in NSCLC cell lines and immortal bronchial epithelial cells (Beas-2B) differing in endogenous and drug-induced levels of HSPA proteins expression. (A) Graphical representation of cell viability following 72 h treatment with CDDP measured by MTS assay (for each dose three independent repeats were performed, each in triplicate). (B) The basal expression of HSPA1, HSPA2, HSPA5, HSPA8 and HSPC protein. Representative immunoblots are shown (n = 3), actin is used as a protein loading control. (C) Graphical representation of cell viability following 72 h treatment with various concentrations of BTZ measured by MTS assay (for each dose at least three independent repeats were performed, each in triplicate). (D,E) Expression of HSPA proteins in cells exposed to CDDP (D) or BTZ (E) for 24 h. Representative immunoblots are shown (n = 4), actin was used as a protein loading control.

