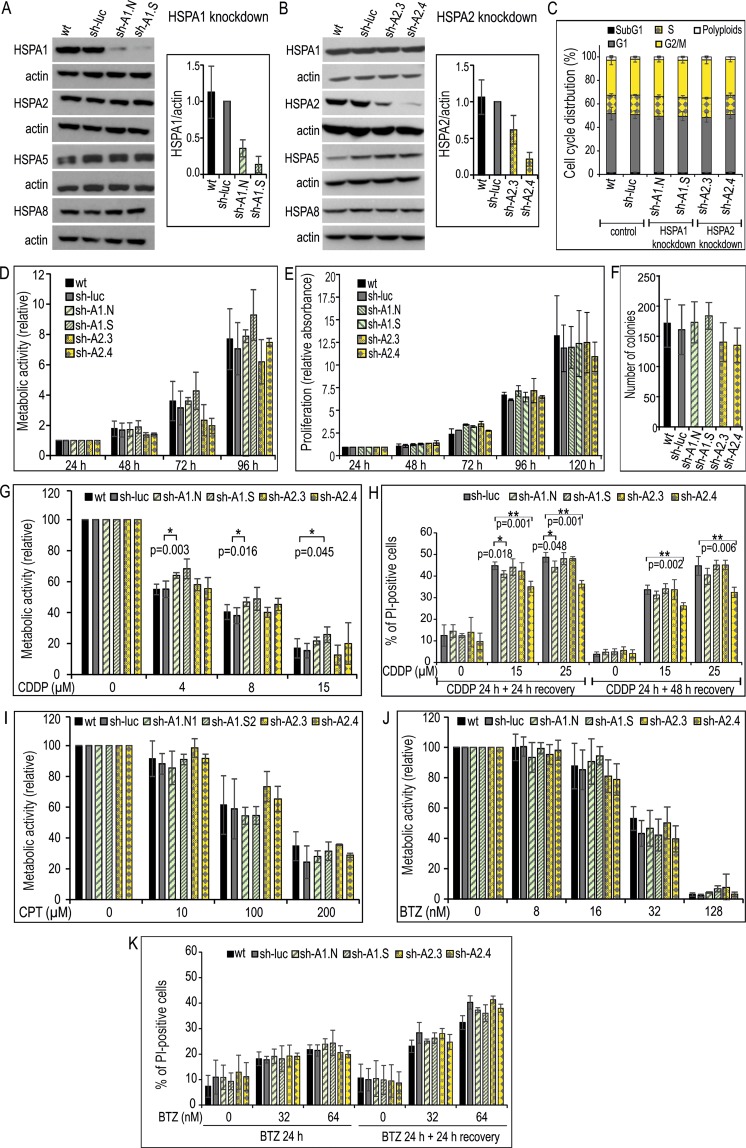
Figure 2.
Effects of HSPA1 or HSPA2 depletion on the proliferation, clone-forming ability and chemoresistance of NCI-H1299 cells. (A,B) Levels of HSPA proteins in wild-type (wt); control sh-luc cells stably transduced with a non-targeting shRNA-luc sequence; sh-A1.N and sh-A1.S cell lines stably transduced with HSPA1-targeting sh-RNA-A1.N or sh-RNA-A1.S sequences, respectively (A); sh-A2.3 and sh-A2.4 cell lines stably transduced with HSPA2-targeting sh-RNA-A2.3 or sh-RNA-A2.4 sequences, respectively (B). Representative immunoblots are shown (n = 3), actin was used as a protein loading control. Graph shows results of densitometric analysis of HSPA1 (A) or HSPA2 (B) immunodetection (HSPA1 n = 3, HSPA2 n = 7). (C) Cell cycle phase distribution in sub-confluent cells at 48 hours (h) after plating. Graph shows percentage of cells (mean ± SD, n = 3, each in two technical replicas). (D) Cell proliferation assessed by MTS assay. Results are expressed as mean ± SD (n = 3, each in three technical replicas) in relation to values obtained at 24 h after plating. (E) Results of proliferation assay (n = 3, each in six technical replicas) assessed using crystal violet staining. Relative absorbance of stained cells was plotted against time (24–120 h) of continuous growth. (F) Number of colonies formed by cells plated onto 6-well dishes (1 × 10³ cells/well) and cultured for 7–8 days. Colonies were counted manually (mean ± SD, n = 5 each in three technical replicas). (G,K) Effects of HSPA1 or HSPA2 depletion on resistance of cells to cisplatin (CDDP) (G,H), carboplatin (CPT) (I) or bortezomib (BTZ) (J-K). Cell viability was measured using MTS assay after 72 h treatment (G,I,J). Results are expressed relative to untreated control (mean ± SD from at least three independent experiments, each in triplicate, *p < 0.05, statistical significance was determined by two-tailed t-test). Cell death detection using propidium iodide (PI) uptake test after 24 h treatment with CDDP (H) or BTZ (K) and/or following 24 or 48 h growth without drugs. Results show mean values ± SD from two (H) or three (K) independent repeats, each at least in duplicate. Statistical significance was determined using two-tailed t-test.

