Figure 5.
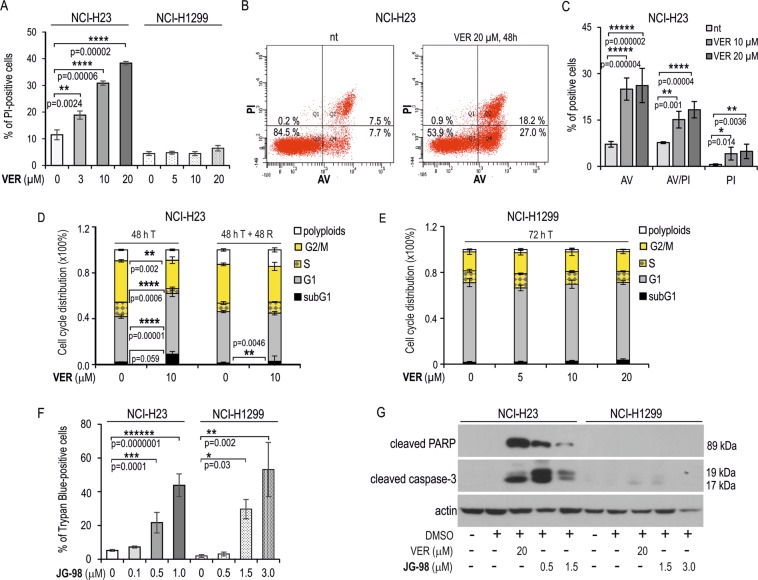
Inhibition of HSPAs by VER and JG-98 lead to apoptosis in NCI-H23 but not in NCI-H1299 cells. (A) Cell death detection after 72 h treatment of NCI-H23 and NCI-H1299 cells with VER-155008 (VER). Results of propidium iodide (PI) uptake test show mean values ± SD (n = 3, each in duplicate). Statistical significance was determined using two-tailed t-test. (B,C) Flow cytometry analysis of cell death in NCI-H23 cells incubated with VER performed using Annexin V (AV)/PI double labeling method. Cells were plated onto 6-well dishes (2 × 10⁴/well) and treated for 48 h. Graph shows percentage of cells labeled with AV and/or PI (mean value ± SD, n = 3). (D,E) Distribution of the cell cycle phases in NCI-H23 (D) and NCI-H1299 (E) cells non-treated (0) or treated for 48 h with VER (5, 10, 20). Cell cycle phases distribution was analyzed immediately after treatment (72 h T) or followed by 48 h of recovery (48 T + 48 R). Graph shows percentage of cells (mean ± SD) calculated from seven (NCI-H1299 cells) or two (NCI-H23) independent experiments, each in duplicate. Statistical significance was calculated using two-tailed t-test. (F) Cell death detection after 72 h treatment of NCI-H23 and NCI-H1299 cells with JG-98. Results of trypan blue staining assay show mean values ± SD (n = 3, each in duplicate). (G) Western blot analysis of activated caspase-3 and cleaved PARP in cells non-treated and treated with JG-98 or VER (72 h). Representative immunoblots are shown (n = 2), actin was used as a protein loading control. In (A), (C) and (F) statistical significance was determined by one-way analysis of variance (ANOVA) and Scheffe’s pairwise post hoc test.

