
Figure 6.
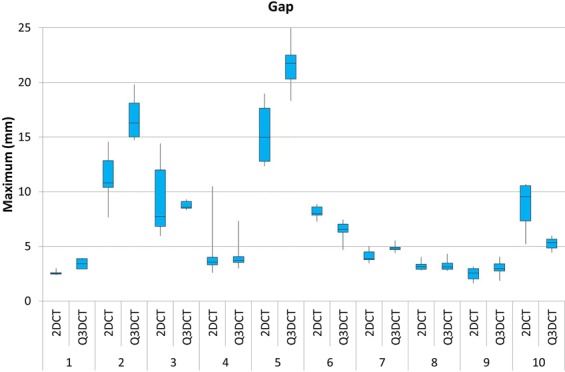
A boxplot showing the dispersion of the maximum gap measurements from 2DCT slices in comparison to our 3DCT measurements, performed by six different observers for all the patients.
Official websites use .gov
A
.gov website belongs to an official
government organization in the United States.
Secure .gov websites use HTTPS
A lock (
) or https:// means you've safely
connected to the .gov website. Share sensitive
information only on official, secure websites.
A boxplot showing the dispersion of the maximum gap measurements from 2DCT slices in comparison to our 3DCT measurements, performed by six different observers for all the patients.