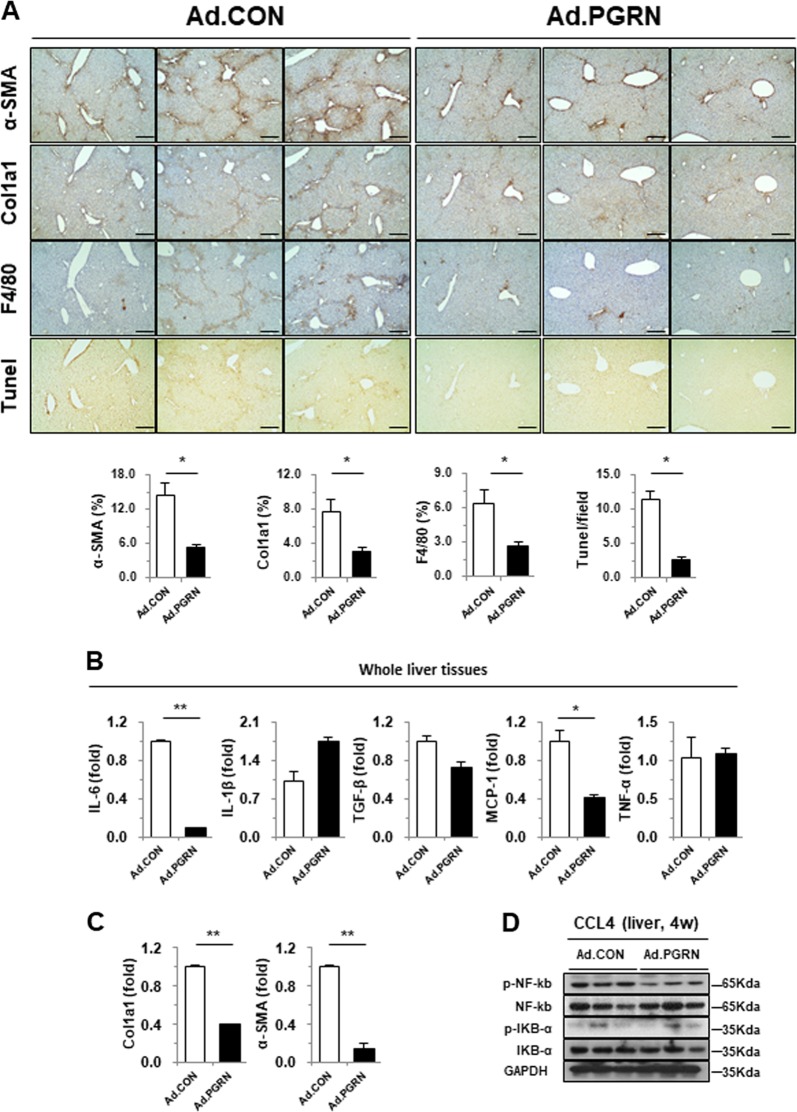
Fig. 2. Effect of PGRN on liver fibrosis-related protein expression in CCl4-treated mice.
a Immunohistochemical staining of liver sections for α-SMA, collagen 1a1, F4/80 antigen, and apoptotic cells (TUNEL). The mean number of positively stained cells per high-powered field was quantified. Scale bar: 200 μm. b, c Whole liver tissues were subjected to gene expression analysis by real-time qPCR. d Liver tissues were subjected to western blot analysis. Graphs show the mean ± SEM. *p < 0.05 and **p < 0.01 versus the corresponding control, as shown

