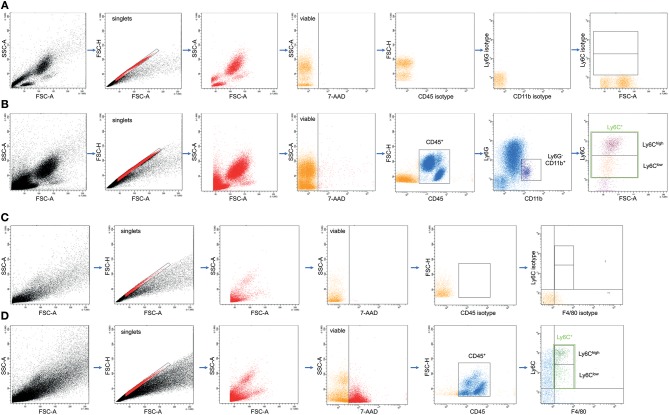
Figure 2.
Representative gating strategy for the flow cytometric analyses and evaluation of different monocyte subsets in whole blood (A,B) and macrophage subsets in lungs (C,D) as dot plot analyses is shown. (A,C) are showing the gating upon staining with isotype control antibodies, while (B,D) show results from the staining with specific antibodies as described in the material and method section.

