
Figure 1.
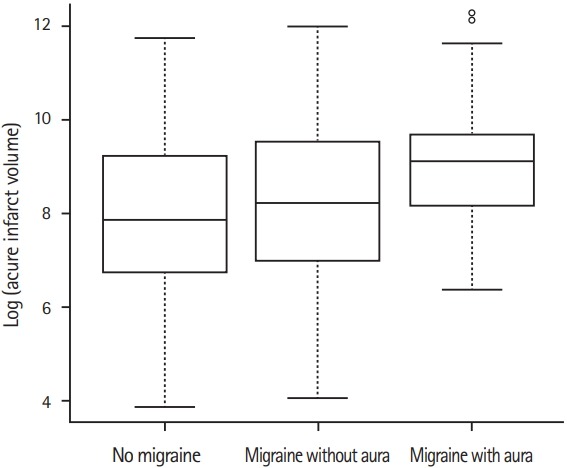
Box-plots of log (acute infarct volume) values by migraine subgroups. In the box-plot the central rectangle spans the first quartile to the third quartile (interquartile range). A bold segment inside the rectangle shows the median and “whiskers” above and below the box show the locations of the minimum and maximum; outside box-plot points are outliers.