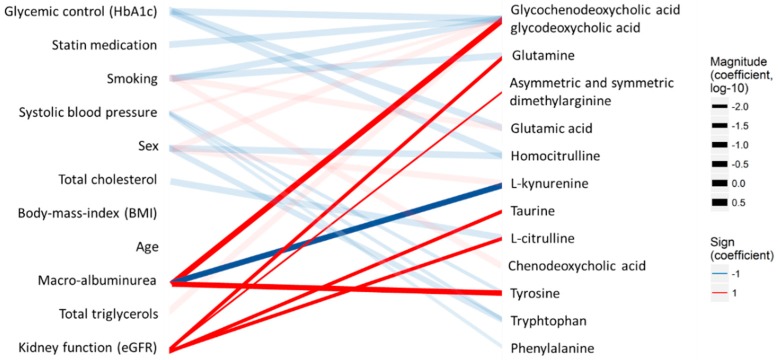
Figure 2.
Associations between clinical measurements (left) and the quantified analytes (right) in the type 1 diabetes T1D cohort. The lines indicate statistical associations (red—positive association and blue—inverse/opposite association; line width—strength of the association). Associations directly related to diabetic kidney disease are highlighted with bold lines.

