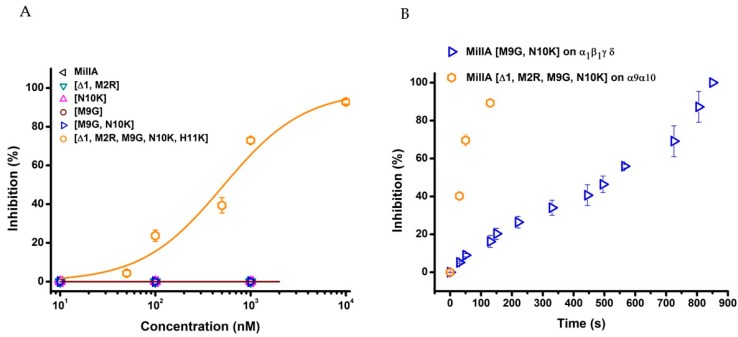
Figure 6.
(A) Concentration-response curves on α9α10 nAChR. The percentage of inhibition was plotted against the logarithm of the different concentrations tested and fitted with the Hill equation. The visualized error bars represent the standard error of the mean (S.E.M). All experiments were repeated at least three times (n ≥ 3). (B) The time duration of the recovery of nAChR response to ACh after inhibition. Blue line: washout kinetic for MilIA [M9G, N10K] on α1β1γδ nAChR; Orange line: washout kinetic for MilIA [∆1,M2R, M9G, N10K, H11K] on α9α10 nAChR.

