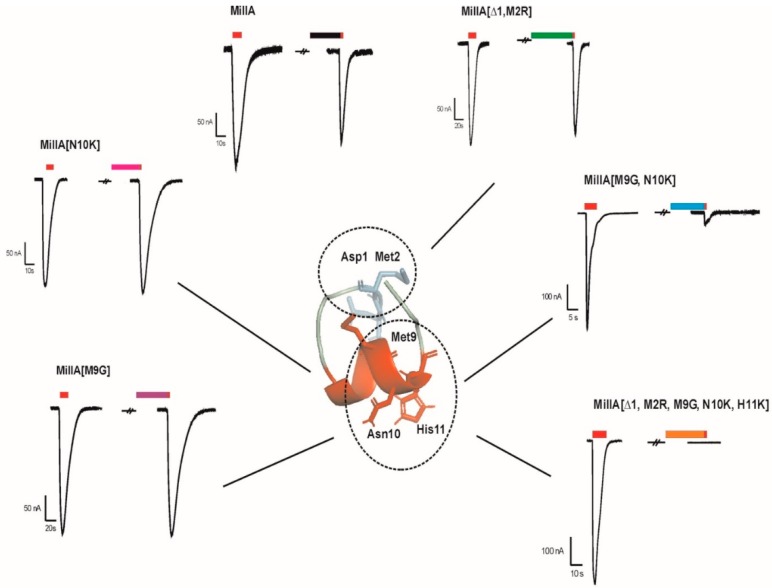
Figure 8.
Selected traces of the α1β1δε nAChR showing effects induced by MilIA and its mutants. All of the components tested at a concentration of 1 µM could induce a block. The double and triple mutants showed the highest inhibition. The visualized error bars represent the standard error of the mean (S.E.M). All experiments were repeated at least three times (n ≥ 3). The key residues are highlighted as lines.

