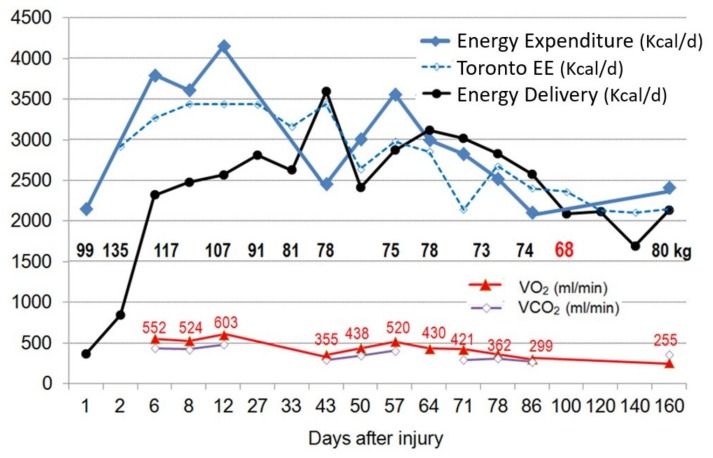
Figure 3.
Evolution of measured REE by IC (blue), Toronto predictive equation (dashed blue), delivered energy (black), VO2 (red △), and VCO2 (purple ◆) in a young man weighing 99 kg upon admission with major burns covering 85% body surface over 160 days. The REE variations were important over time particularly during the early phase (weight gain due to fluid resuscitation was 36 kg by day 3), and paralleled the loss of body weight, i.e., of lean body mass (−31 kg after 3 months, with slow recovery). The REE value on day 1 corresponds to the Harris & Benedict prediction of basal EE. The figure also shows the reasonable precision of the Toronto equation, and how difficult it is to feed to measured IC value during the first 14 days. Adapted from [32].

