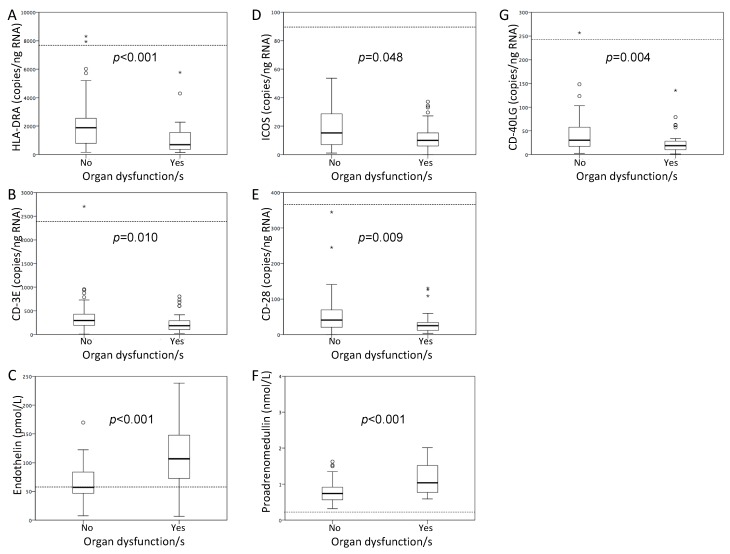
Figure 1.
Box plots representing genes expression and biomarker levels according to the presence of organ dysfunction/s. The boxes show the interquartile range and the line inside shows the median. Dashed lines show the median values of the healthy controls. HLA-DRA: histocompatibility complex class II DR alpha; ICOS: Inducible T-cell costimulator; CD40LG: CD40 ligand (A) HLA-DRA. (B) CD3E. (C) Endothelin. (D) ICOS. (E) CD28. (F) Proadrenomedullin. (G) CD40LG. For comparison purposes, the Mann–Whitney U test was used.

