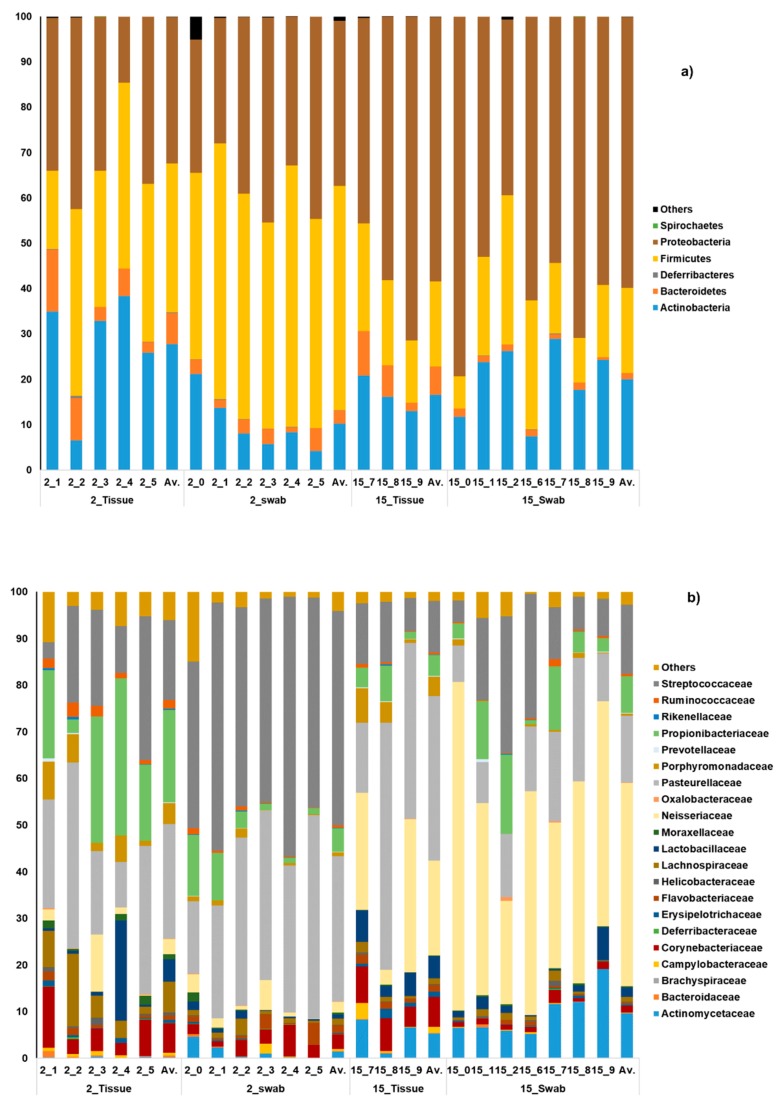
Figure 3.
Bacterial community composition at phyla (a) and family (b) level. Age is represented in months (ex. 2_tissue: Tissue biopsies of 2 months old mice). (a) The average relative abundance of each phyla (a) and family (b) detected in each sample of cotton swab and tissue biopsies from each age group are shown alongside each other. The average (Av.) of each set of samples is shown in the last column of each group.

