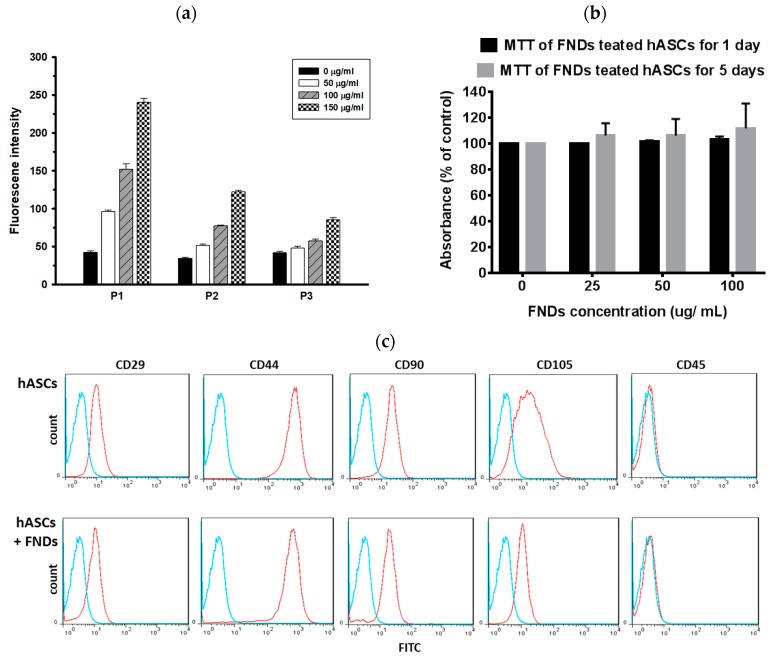
Figure 3.
(a) Fluorescence intensity of FND-labeled hASCs was detected after each passage. 1 × 10⁵ hASCs were labeled with FNDs (0, 50, 100, 150 μg/mL). Values are means ± S.E.M. from three independent experiments. Data were assessed using one-way ANOVA, followed by Turkey’s multiple comparison tests. (b) 1 × 10⁵ hASCs were treated with FNDs (0, 25, 50, 100 μg/mL) for one and five days, followed by MTT analysis. Values represent the means ± S.D. of three independent experiments. Data were assessed using T tests. (c) Surface markers of hASCs. Representative flow cytometry analysis demonstrated positives for mesenchymal stem/stromal cells markers CD29, CD44, CD90, and CD105, but negative for CD45. Blue lines indicate the isotype control. FITC-A, fluorescein isothiocyanate area.

