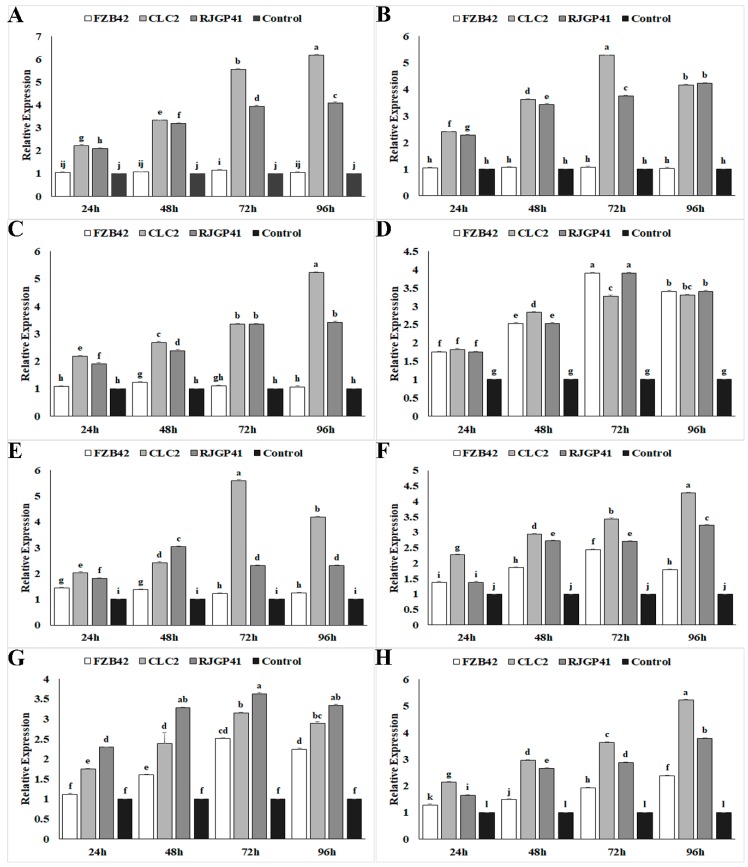
Figure 3.
The graphs representing relative expression levels of different genes analyzed at multiple time intervals in Bacillus strains FZB42, CJCL2, and RJGP41 grown at 4 °C and 37 °C. The analyzed genes were: cspB (A), cspC (B), cspD (C), comA (D), desK (E), desR (F), ohrR (G), OpuAC (H). The error bars on the graphs indicate the standard deviation of the mean (n = 3). Letters above the columns represent significant differences between treatments at p ≤ 0.05. The expression studies were repeated three times with similar changes in expression.

