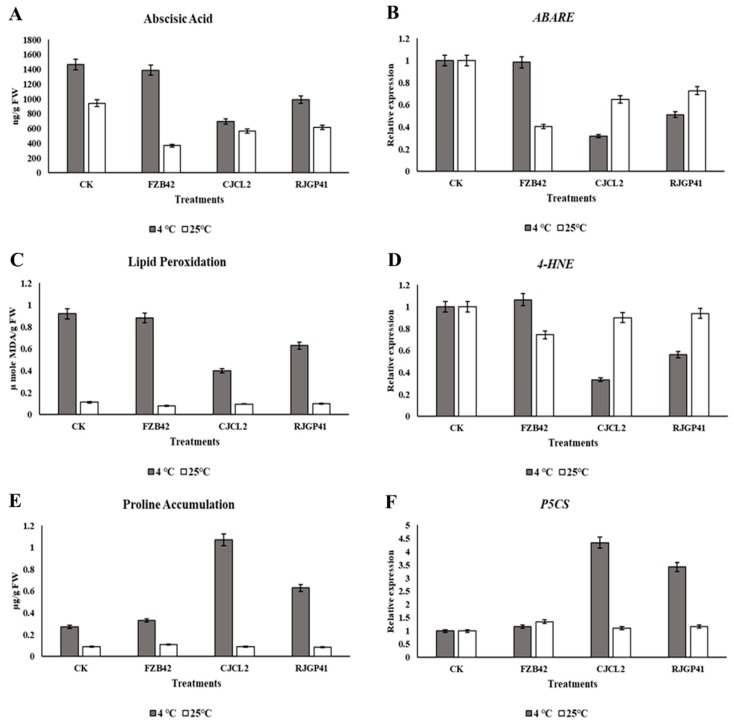
Figure 9.
Quantification of abscisic acid by UPLC in wheat plants grown at 4 °C and 25 °C under different bacterial treatments (A). Relative expression level abscisic acid (ABA) encoding gene (ABARE) (B). Spectrophotometric quantification of malondialdehyde (MDA) from wheat plants (C). Relative expression level of MDA encoding gene (4-HNE) (D). Spectrophotometric quantification of proline (E). Relative expression level of ARF gene encoding proline synthesis (F). The error bars represent the standard deviation of the mean (n = 3). The significant difference was observed for all treatments by using Tukey’s HSD test at p ≤ 0.05 and the experiment was repeated in triplicate with similar results.

